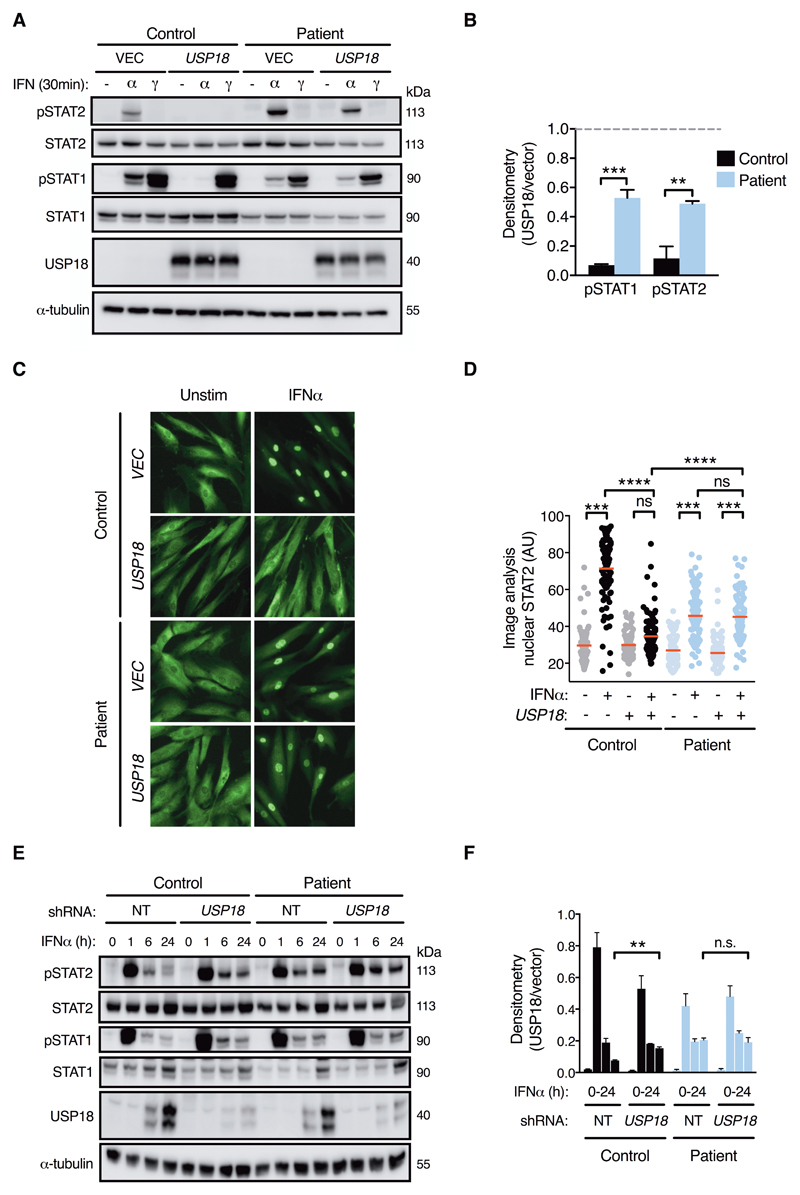
Fig. 7. USP18 insensitivity in cells bearing STAT2R148W.
All data are from patient II:3 and control fibroblasts. (A) STAT phosphorylation in USP18 and vector expressing fibroblasts (immunoblot) with (B) pSTAT densitometry analysis (pSTAT/tubulin, ratio to unprimed, n=3, ANOVA with Sidak’s post-test). (C) Immunofluorescence analysis of STAT2 nuclear translocation (1000 IU/ml IFNα, scale bar = 100μm, representative of n=3 experiments) with (D) image analysis (n=100 cells/condition, ANOVA with Sidak’s post-test). (E) Timecourse of STAT phosphorylation upon IFNα stimulation (1000 IU/mL for 0, 1, 6 and 24 h) of cells transduced with USP18 shRNA or non-targeting (NT) shRNA with (F) densitometry analysis of pSTAT2 (n=3, t test). Data are mean ± SEM (** P<0.01, *** <0.001, **** <0.0001, ns = nonsignificant).

