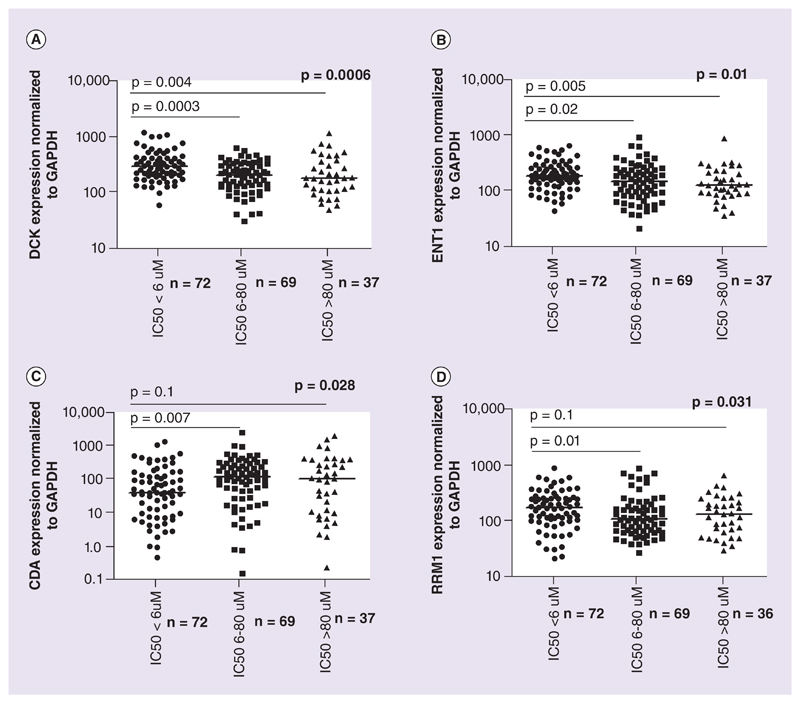
Figure 2. Ara-C metabolizing genes expression across different ex vivo cytotoxicity groups.
RNA expression of Ara-C metabolizing genes DCK, ENT1, CDA and RRM1 in different ex vivo cytotoxicity groups based on IC50: (A) DCK, (B) ENT1, (C) CDA and (D) RRM1. RNA expression for each gene was normalized to GAPDH and the relative expression was calculated in comparison to that of AML001. Lines represent median relative expression for each *p-value obtained by comparing the groups by ANOVA. Statistical significance was measured using the nonparametric Kruskal–Wallis test.

