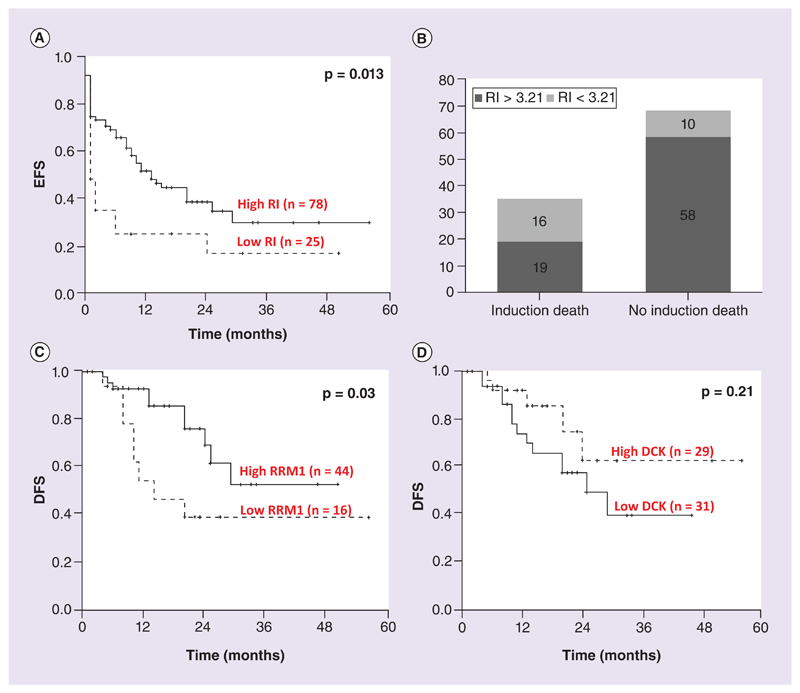
Figure 4. Kaplan–Meier survival estimates for RI, DCK and RRM1 expression.
(A) EFS comparison for patients with lowest quartile RI (RI < 3.21) versus the rest (RI > 3.21). (B) Bar graph showing the number of patients with low RI (RI < 3.21) and high RI (RI > 3.21) with or without induction death. (C & D) DFS comparison with respect to RRM1 (lowest quartile vs the rest) and DCK (based on median).DFS: Disease-free survival.

