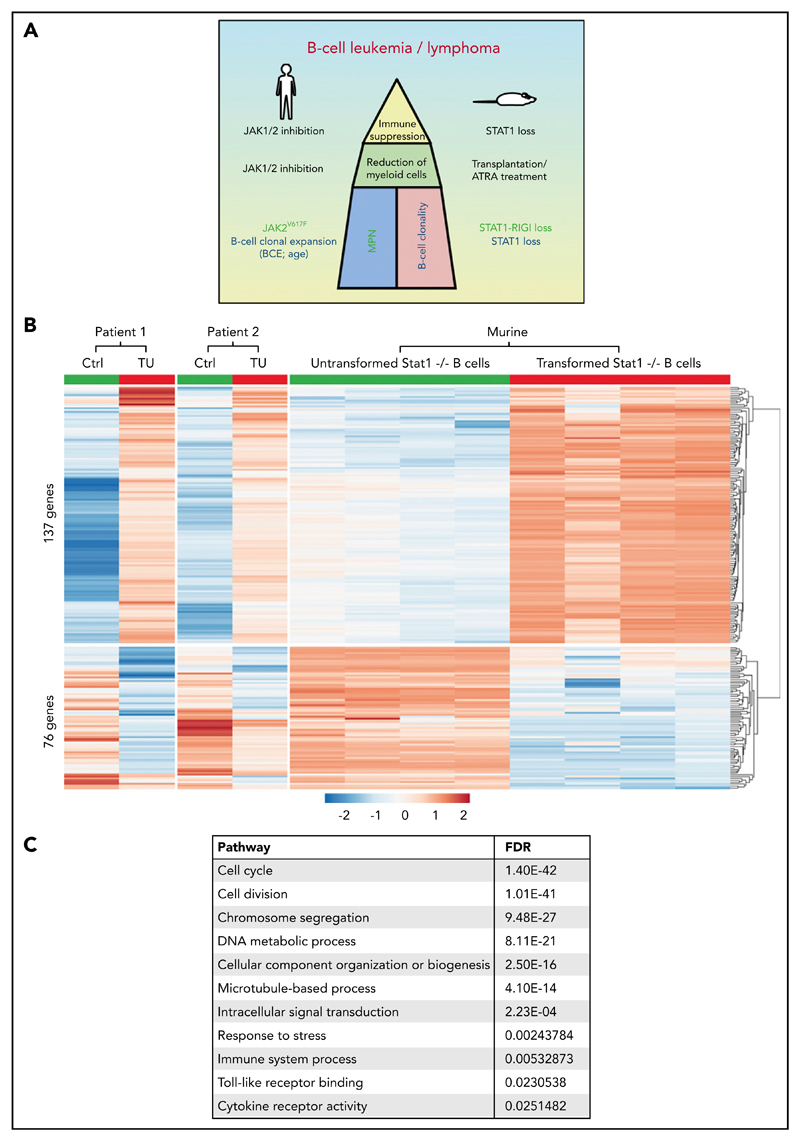
Figure 4. Human aggressive B-cell lymphoma share gene expression profiles with Stat1−/− B cells.
(A) Scheme summarizing and comparing disease etiology of MPN and B-cell malignancy in patients and Statl −/− mice. (B) Identification of commonly deregulated genes in transformed murine Statl −/− B-cell lines and in FACS-sorted CD20-positive malignant B cells from the bone marrow of patient 1 and infiltrated (>98%) lymph node from patient 2. The heat map shows 137 genes whose expression is upregulated and 76 genes whose expression is downregulated in tumor samples (TU) from patients 1 and 2 (compared with FACS-sorted and pooled B cells from the peripheral blood of 2 healthy donors or lymphocytes isolated from lymph node tissue of 1 healthy donor [Ctrl]) and in transformed murine Statl −/− B cells (compared with FACS-sorted untransformed splenic B220+ IgM+ IgD+ CD43− Statl −/− B cells). Colors range from blue (low expression) to red (high expression). Each row represents a single transcript, and each column represents a unique cell/tissue specimen. (C) Gene ontology enrichment analyses reveal that 213 deregulated genes are involved in cell cycle and immune response processes.

