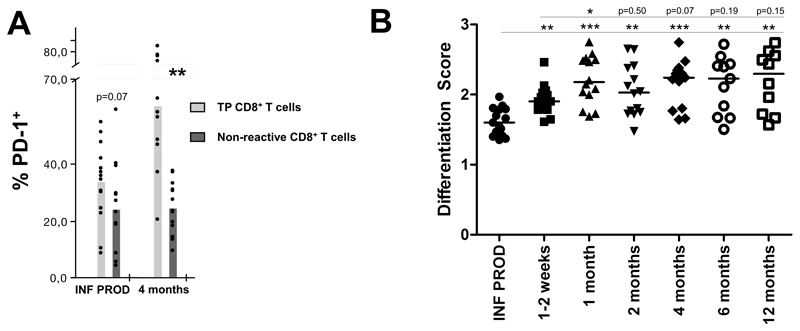
Figure 3. PD-1 expression and differentiation score of tumor-reactive CD8+ T cells phenotype after cell transfer.
(A) The percentage of cells expressing PD-1 among the TP tumor reactive and non tumor-reactive CD8+ T cells is shown. Infusion products n=15, peripheral blood 4 months after infusion n=13 (B) The scatter plot shows the differentiation score given to each sample at each time point. * p<0.05; ** p<0.01; *** p<0.001

