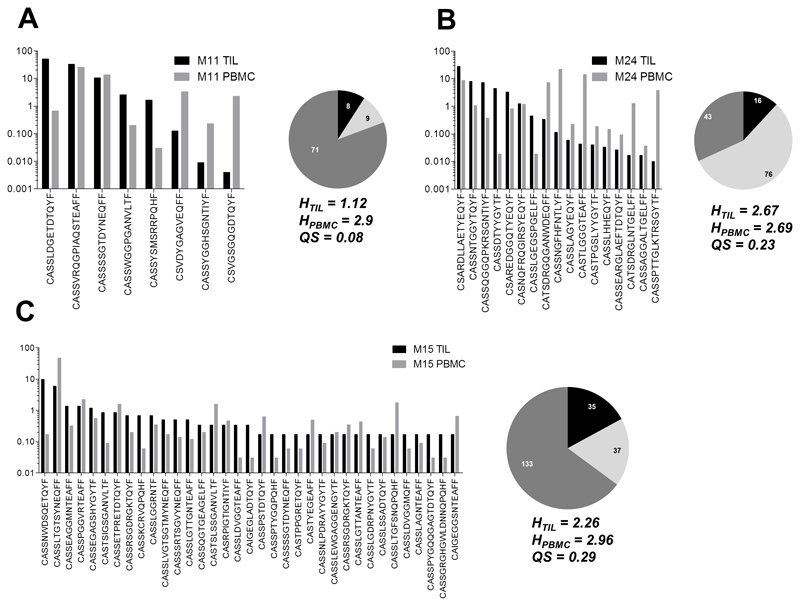
Figure 4. Tumor-reactive CD8+ T cell clonotypes from infusion products persist in the blood up to 6 months post-treatment.
The frequency of TCR-β chain sequences found in both TIL (solid bar) and peripheral blood samples (white bar) is shown for A) patient M11, B) patient M15, and C) patient M24. The absolute number of shared (black) and unique (light grey for TIL; dark grey for PBMC) TCR-β chain sequences for each patient is shown as pie charts. Out-of-frame chains and ambiguous sequences were discarded from analysis. Shannon entropy (H) was calculated for TIL and PBMC samples, and compositional similarity measured by the Sørensen coefficient (QS). H values increase with TCR diversity; QS increases with repertoire overlap.

