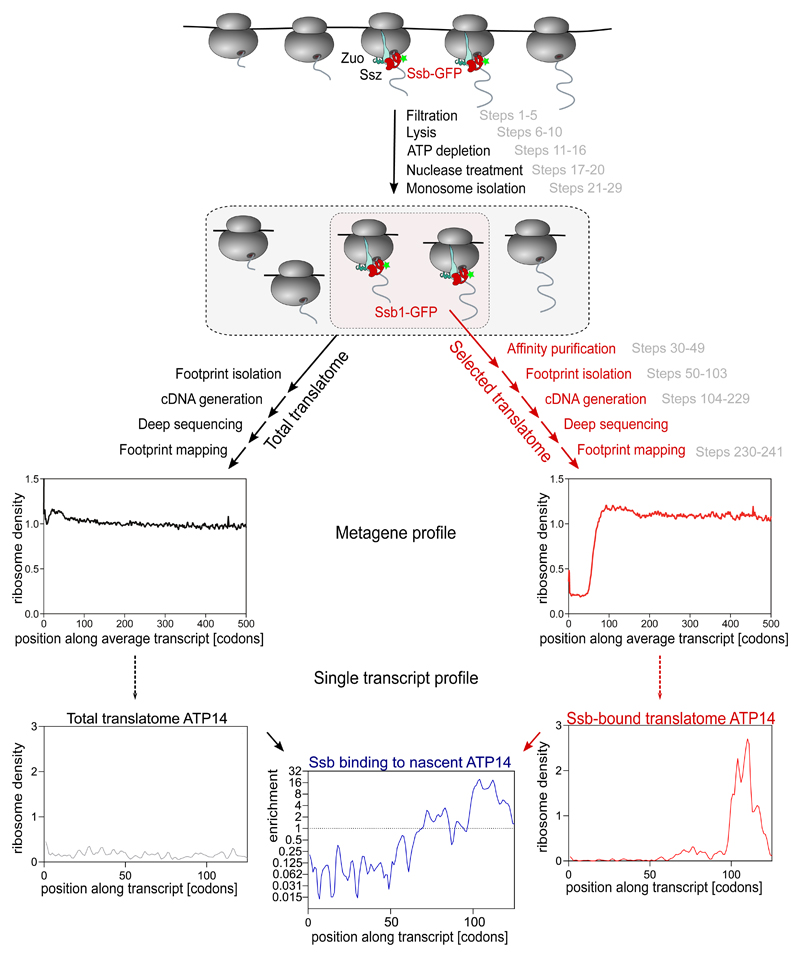
Figure 1. Schematic overview on selective ribosome profiling (SeRP) exemplified for the yeast Hsp70 chaperone Ssb.
Cells are collected by rapid filtration and lysed in frozen state. Lysates are nuclease treated to generate monosomes. Ribosome footprints are isolated and converted to a cDNA library (corresponding procedure steps are shown in grey). Following deep sequencing, footprint reads are mapped to the reference sequence. Metagene analyses, disclose the density of ribosomes averaged over all transcripts. Footprint numbers reveal gene expression levels and the read distribution along transcripts (exemplified for the gene ATP14) provides information on local translation kinetics. SeRP involves parallel processing of two ribosome pools: (i) all ribosomes, revealing the "total translatome" (black) and (ii) the Ssb-bound “selected translatome” (red). Forming the ratio of Ssb-bound translatome and total translatome data reveals length-resolved nascent protein interaction profiles (blue, shown here is the Ssb binding to nascent ATP14).

