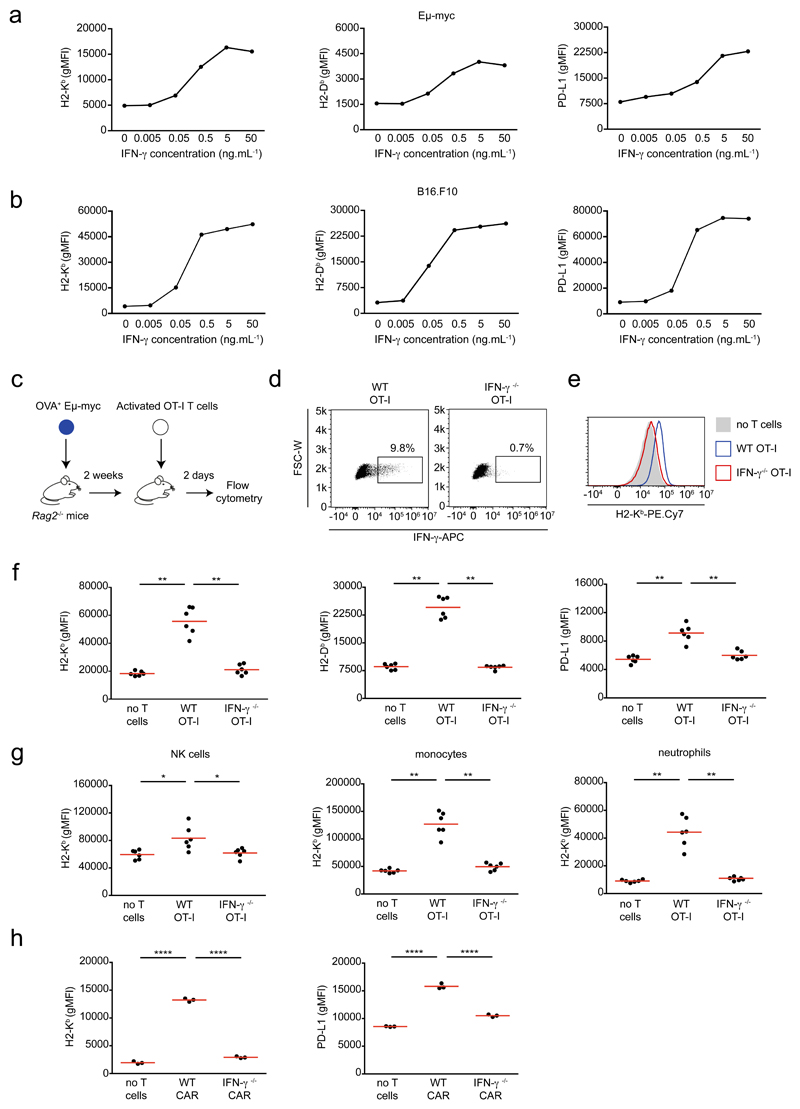
Figure 1. T cell-derived IFN-γ induces phenotypic changes in the tumor micro-environment.
a-b IFN-γ induces phenotypic changes in tumor cells in vitro. Eμ-myc B lymphoma (a) or B16.F10 melanoma (b) cells were stimulated with indicated IFN-γ concentrations in vitro for 24h. H2-Kb (left), H2-Db (middle) and PD-L1 (right) surface expression was then analyzed by flow cytometry. Each dot represents the mean of 3 technical replicates. Representative of 2 (B16.F10) or 3 (Eμ-myc) independent experiments. c-g T cell-derived IFN-γ increases MHC class I and PD-L1 levels in tumor and tumor-infiltrating immune cells. c Experimental set-up. Rag2-/- mice were injected i.v with OVA-expressing Eμ-myc B lymphoma cells. On day 12-13, in vitro activated WT or IFN-γ -deficient OT-I CD8+ T cells were injected i.v. Two days later, the recipient bone marrow was harvested and analyzed by flow cytometry. d Intracellular IFN-γ staining was performed in the absence of in vitro restimulation. Dot plots showing IFN-γ production by intratumoral WT OT-I T cells but not IFN-γ -deficient OT-I T cells. Data are representative of n=6 mice per group. e Representative example of histograms showing H2-Kb surface expression on tumor cells isolated from the bone marrow of mice that were left untreated (filled grey) or injected with either WT OT-I T cells (line, blue) or IFN-γ -deficient OT-I T cells (line, red). Data are representative of two independent experiments with n=6 mice per group. f H2-Kb (left), H2-Db (middle) and PD-L1 (right) surface expression on tumor cells isolated from mice treated or not with the indicated OT-I T cell population, as assessed by flow cytometry. Each dot represents one mouse. Red lines indicate mean values. Data are representative of two independent experiments with n=6 mice per group. (** P< 0.01, two-tailed Mann Whitney U-test). g H2-Kb surface expression on NK cells (left), monocytes (middle) and neutrophils (right) isolated from mice treated or not with the indicated OT-I T cells, as assessed by flow cytometry. Red lines indicate mean values. Data are representative of two independent experiments with n=6 mice per group. (* P<0.05, ** P< 0.01, two-tailed Mann Whitney U-test). h Recipients with established Eμ-myc B cell lymphoma were treated with anti-CD19 CAR T cells and analyzed 2 days later. H2-Kb (left) and PD-L1 (right) surface expression on tumor cells isolated from mice left untreated or treated with WT or IFN-γ -deficient CAR T cells. Red lines indicate mean values. Data are representative of 2 independent experiments with n=3 mice per group. (****, P<0.0001, ANOVA, with Tukey's test for multiple comparisons).

