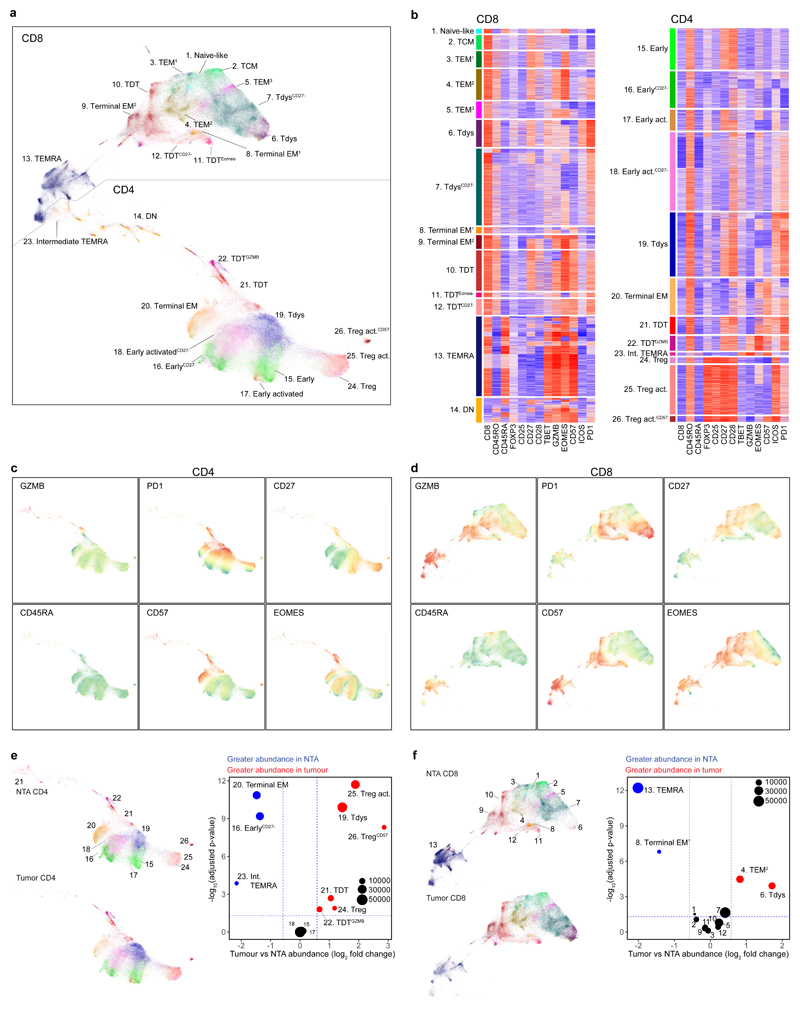
Figure 1. The landscape of tumour infiltrating CD4 and CD8 T cells in non-small cell lung cancer.
(a) T cell clusters identified in high dimensional flow cytometry analysis of n=41 regions from 15 patients with NSCLC are visualized by UMAP dimension reduction. (b) Heatmaps show min-max scaled, transformed expression of markers expressed by CD8 and CD4 T cells. Each row represents an individual cell from a sample of 10,000 cells from each population. UMAP projections show expression intensity of key markers in CD4 (c) and CD8 (d) T cells. (e, f) Analysis of differential cluster abundance in tumour (n=41 regions) vs. non-tumour adjacent (NTA; n=18 regions) tissue for CD4 (e) and CD8 (f) T cells. FDR adjusted p-values (quasi-likelihood F-test with edgeR) and log2 fold change values are represented for each cluster in the volcano plots, the size of points reflects cluster abundance.

