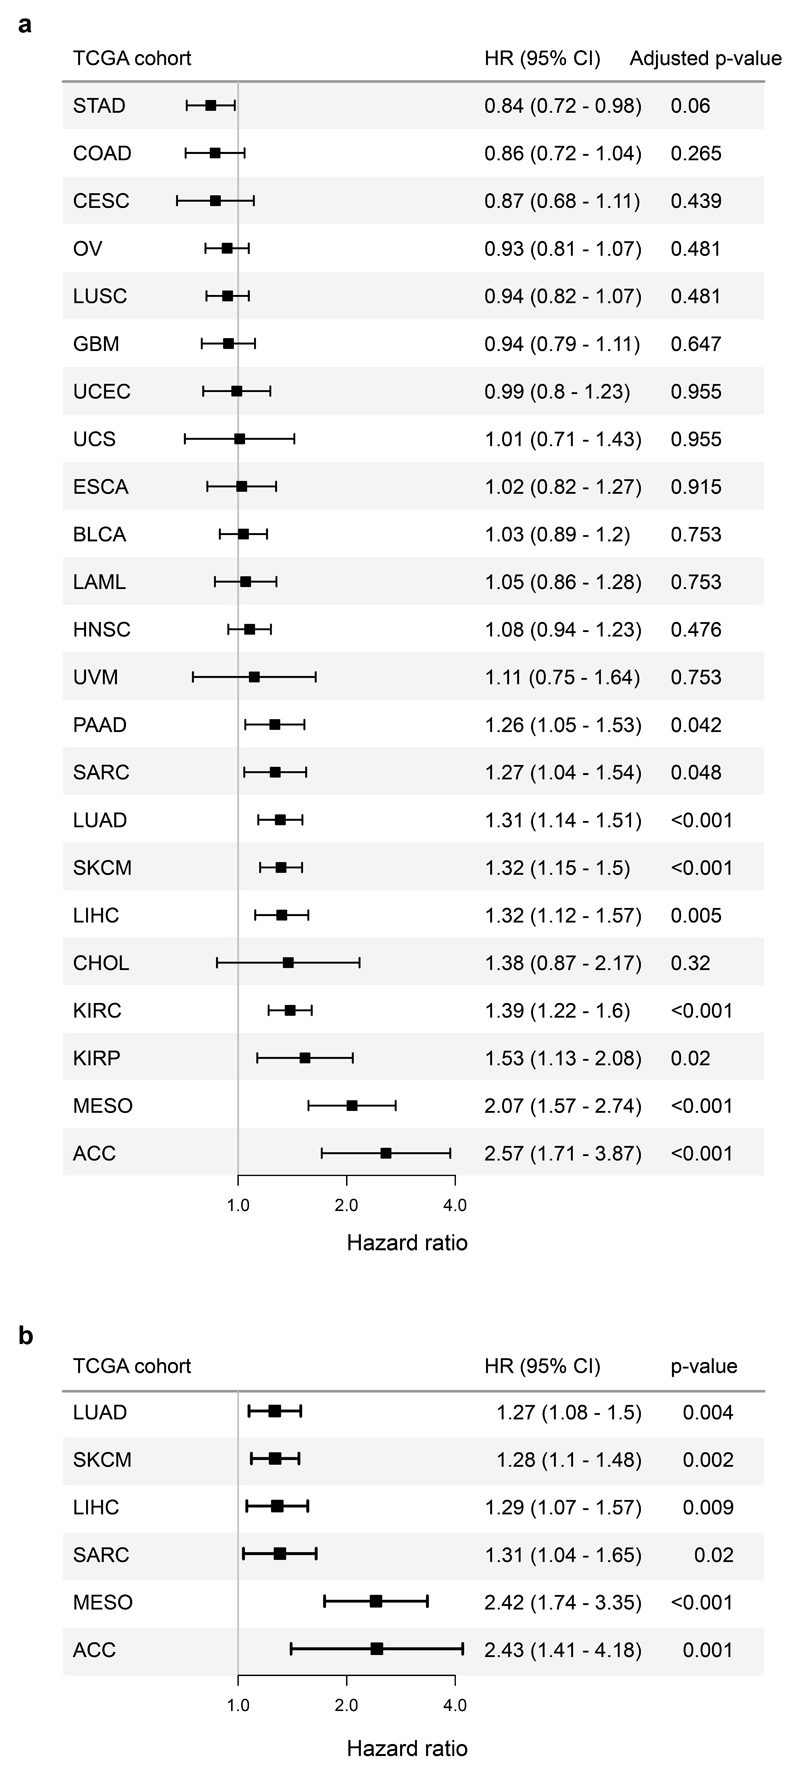
Extended Data Fig. 8. Pan-TCGA association between a signature of T cell differentiation skewing and patient outcomes.
(a) Forest plot showing the relationship between the TL-DS signature and survival across TCGA cohorts (n=6853 patients). HRs and FDR adjusted p-values are from univariable Cox regression analysis. (b) Relationship between the TL-DS signature and survival, corrected for T cell infiltration, TMB and stage, in cohorts from (b) in which the signature predicted survival (9 cohorts, n=2418 patients). HRs and p-values are from multivariable Cox regression analysis. Cohorts in which the relationship was significant are shown.

