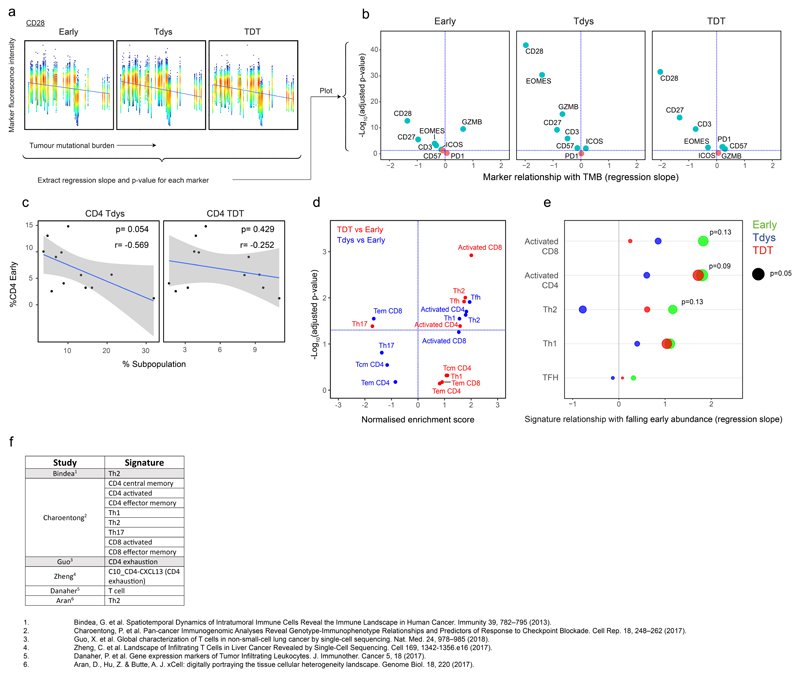
Extended Data Fig. 10. Marker and transcriptional changes within the CD4 Early population in relation to TMB and subset abundance.
(a) Workflow to determine the relationship between flow cytometry measured marker expression intensity and TMB in CD4 Early (n=23,597 cells), Tdys (n=25,271 cells) and TDT (n=11,880 cells) subsets. Each point represents an individual cell, FDR adjusted two-sided p-values and regression coefficients were derived from linear mixed effects models accounting for patient histology and tumor multiregionality and plotted in (b). Volcano plots show the relationship between marker intensity and TMB for each CD4 subset. (c) Change in CD4 Tdys and TDT with Early abundance (as a percentage of all CD4+ cells, n=12 patients). Two-sided Pearson p- and r-values are shown. Shaded bands represents the 95% confidence interval of a linear regression slope. (d) GSEA of T helper subset signatures enriched in Tdys and TDT vs. Early (n=590 cells), using modules from Charoentong et al. 201778. Normalized enrichment scores (NES) and FDR adjusted p-values from permutation tests are shown. (e) Correlation between falling abundance of the CD4 Early population (175 cells, n=12 patients) and expression of gene signatures from (d) indicative of CD4 later differentiation state. Two-sided p-values and regression coefficients were derived from linear mixed effects models with patient as the random effect. Published T cell subset signatures used in the study are summarized in (f).

