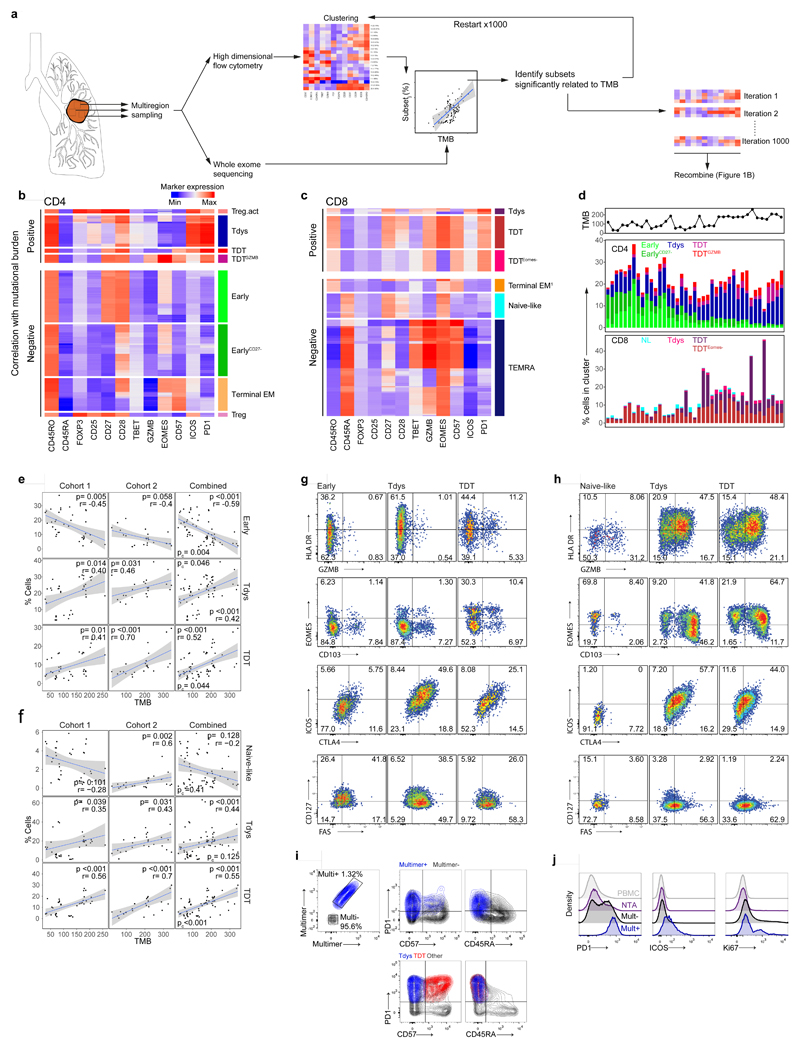
Figure 2. T cell differentiation skewing occurs in association with tumour mutational burden.
(a) Workflow to identify clusters of intratumour T cells that vary in abundance in association with TMB. Heatmaps show min-max scaled, transformed marker expression of CD4 (b) and CD8 (c) clusters that vary positively (upper region of heatmaps) or negatively in abundance with TMB (Spearman’s rank test; n=37 regions from 15 patients). Cluster abundance was calculated as a proportion of all CD3+ cells in each region. (d) The abundance of CD4 and CD8 clusters identified in (b, c) for all tumour regions is shown. Regional TMB is indicated above the plot. NL, naive-like. (e, f) Populations found to vary in abundance with TMB by unsupervised analysis were manually gated within cohort 1 and a second validation set of n=26 regions from 16 patients drawn independently from the first 100 TRACERx cohort. Scatter plots show the relationship between population abundance and TMB for CD4 (e) and CD8 (f) subsets in cohorts 1 (left columns), 2 (middle columns) and a combined analysis (right column). P- and correlation coefficient r-values are from Spearman’s rank tests. Two-sided p-values (pc) from linear mixed effects regression models to correct for effects of histology and multiple tumour regions are additionally shown. Shaded bands represent the 95% confidence interval of a linear regression slope. (g, h) Marker expression profiles of manually gated CD4 (G) and CD8 (H) subsets in validation cohort 2 (concatenated data from n=16 patients are shown). (i) PD1, CD57 and CD45RA expression profile of neoantigen-multimer reactive (Mult+) CD8 T cells from a representative patient (similar results were found amongst four Mult+ populations from n=3 patients). Lower panel shows corresponding profile of CD8 Tdys and TDT subsets amongst all CD8 TILs. (j) PD1, ICOS and Ki67 expression profile of multimer reactive, non-reactive, NTA localized and circulating (PBMC) CD8 T cells.

