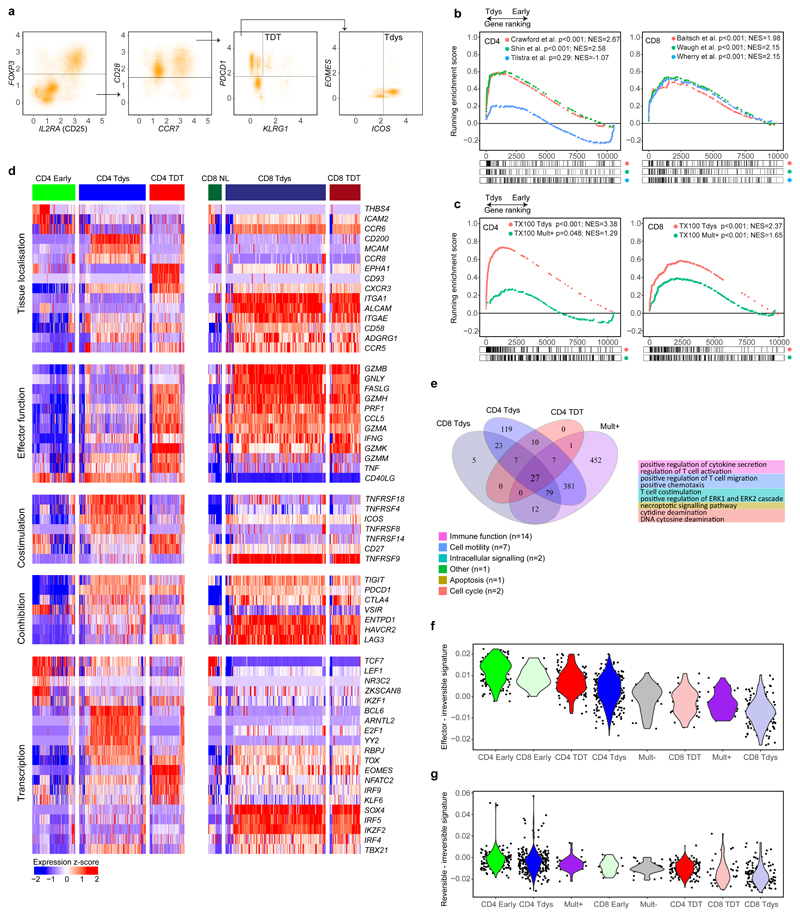
Figure 4. Single cell transcriptomic characterization of CD4 and CD8 subsets reveals distinct regulatory mechanisms.
(a) CD4 and CD8 subsets were identified by a biaxial gating strategy applied to single cell RNAseq data42 (n=14 patients), based on markers identified by flow cytometry. The gating scheme for CD4 Tdys and TDT cells is shown (CD3E + CD3G + CD4 + CD8 - cells were pre-gated, see Figure S3A). Expression values are represented as normalized, log10 transformed read counts per million (log10 CPM). (b, c) GSEA to evaluate enrichment of published gene sets of T cell dysfunction (b) and sorted CD8 Tdys and multimer reactive cells (c), amongst genes ranked by their expression in CD4 Tdys vs. Early (n=272 vs. 175 cells) and CD8 Tdys vs Naive-like populations (n=143 vs. 19 cells). For each gene set tested, the top 200 most differentially expressed genes were selected. Normalized enrichment scores (NES) and FDR adjusted p-values from permutation tests are shown. (d) Heatmaps showing relative expression (z-score) of genes involved in key T cell regulatory pathways. All genes shown are >2-fold differentially expressed in a comparison between two subsets within with same population (FDR adjusted p<0.05). (e) Venn diagram shows sharing of Gene Ontology (GO) terms enriched in single cell analysis of CD8 Tdys vs. Naïve-like (n=143 vs. 19 cells), CD4 Tdys vs. Early (n=272 vs. 175 cells), CD4 TDT vs. Early (n=143 vs. 175 cells) and Mult+ vs. Mult- (n=36 vs. 39 cells). Pathways with FDR adjusted two-sided Wilcoxon rank sum test p-value <0.05 were considered significant. Pathways shared by all populations were grouped according to the legend and exemplary pathways from each group are tabulated. (f, g) Comparison of transcriptional profiles of individual cells in subsets of interest with effector, reversibly dysfunctional and irreversibly dysfunctional antigen-specific CD8 T cells54. Similarity between individual cells in each population (cell numbers as described above) and previously published bulk RNAseq data was calculated by Pearson correlation. Violin plots show the difference between reversible vs. irreversible scores (f) and effector vs. irreversible scores (g) for each population calculated at the single cell level.

