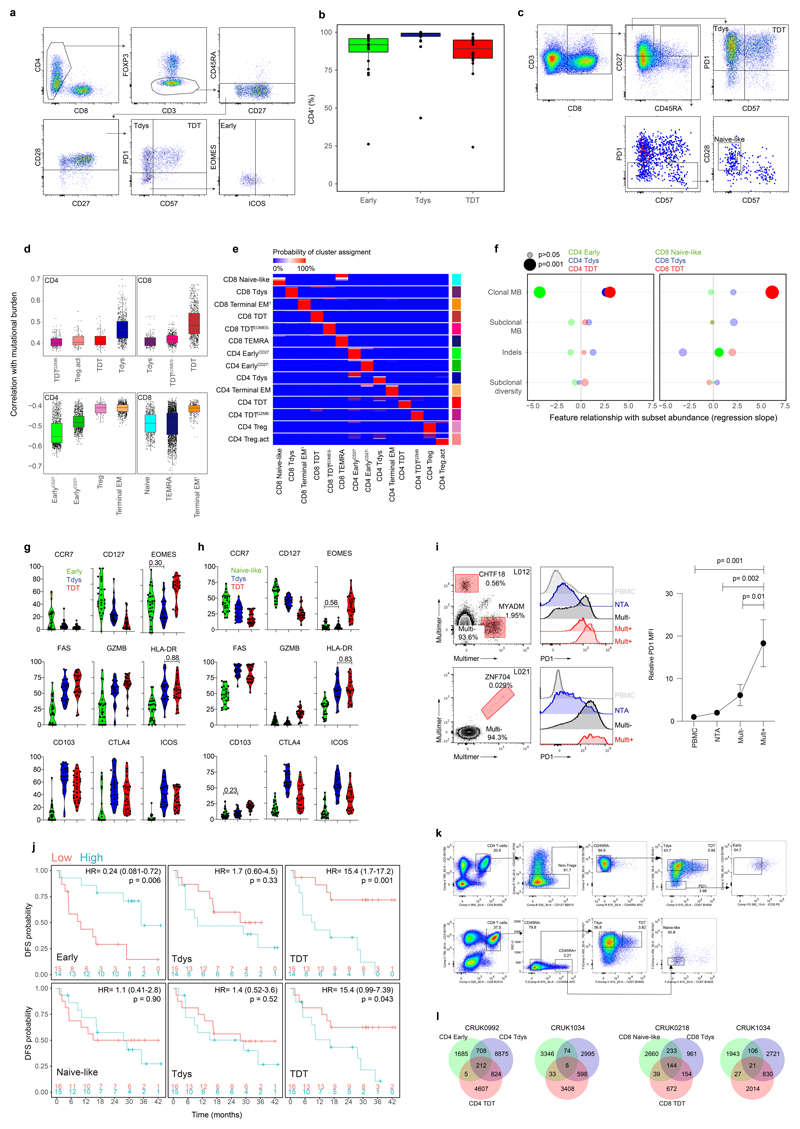
Extended Data Fig. 2. Progenitor-like and dysfunctional T cell subsets correlate with clonal mutational burden and their abundance associates with patient outcomes.
(a) Gating strategy to define CD4 Early, Tdys and TDT populations. (b) For n=20 lung samples with distinct CD4 staining, the percentage of CD4+ cells amongst manually gated Early, Tdys and TDT populations from n=61 total samples, is shown for each subset. (c) Gating strategy to define CD8 Naive-like, Tdys and TDT populations. (d) Boxplots show the Spearman correlation between cluster abundance and TMB (n=39 regions from 15 patients) across all iterations (n=1000) of the clustering workflow. Each point represents the result of a single run. (e) Heatmap showing cluster stability across 1000 clustering iterations. The cluster identity of each cell was determined for one representative iteration (labels are on the left of the heatmap). For each cell, the probability of being assigned to each cluster (labelled below the plot) across all iterations is represented. (f) Relationship between CD4 population abundance (60 regions from 29 patients) and tumor genomic features. Two-sided p-values and regression slopes (β coefficients) reflecting the direction and magnitude of relationships tested are from linear mixed effects regression models accounting for tumor histology and multiregionality. (g, h) Percentage of cells amongst manually gated cohort 2 CD8 (g) and CD4 (h) populations positive for key markers (26 regions from 16 patients). All comparisons p<0.05 by two-sided Wilcoxon rank sum test except for those labelled. Violin plots show median and interquartile range. (i) Neoantigen-multimer reactive (Mult+) CD8 T cell identification and PD1 expression for two patients in comparison to matched multimer non-reactive (Mult-), NTA and circulating (PBMC) CD8 T cells. Line graph shows CD8 T cell PD1 MFI (relative to PBMC) in Mult+, Mult- and NTA populations. Data points show mean PD1 MFI from n=4 multimer reactive populations from n=3 patients, error bars show SEM. P-values are from paired 2-Way ANOVA (Fisher’s least significant difference test). (j) Disease free survival (DFS) probability of patients with high vs. low abundance of CD4 (upper row) and CD8 subsets (from n=29 and n=31 patients respectively), categorized according to the median value. The number of patients at risk at each time point, log-rank p-value and hazard ratios with 95% confidence intervals are shown. (k) Sort strategy for CD4 (top) and CD8 subsets, for TCRseq. (l) Venn diagrams show CDR3 beta chain sharing between CD4 (left two diagrams) and CD8 subsets, for two patients each. Boxplots in (b) and (d) represent median and interquartile range.

