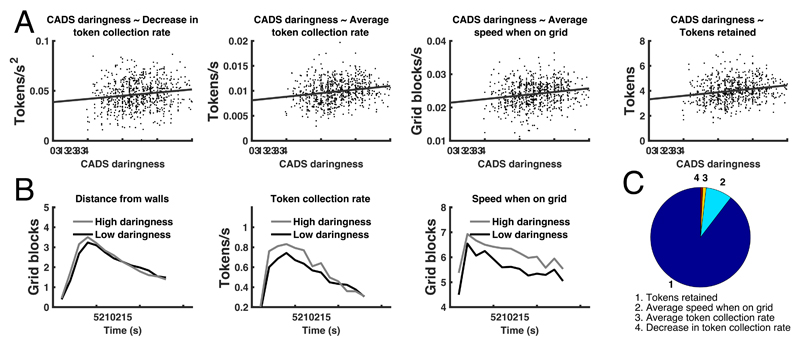
Figure 3. Relation of self-reported daringness (CADS questionnaire) with task measures.
A: Individual task measures that relate to daringness. B: Average trajectories of the 20 highest-scoring and the 20 lowest-scoring individuals in the discovery sample for those measures in which daringness predicted trajectory similarity. C: Proportion of additionally explained variance by each task measure, after residualizing already explained variance, and normalized for the overall explained variance. In terms of bivariate relations, daringness explained, across the entire sample 3.9% (1.6%-7.1%), 3.4% (1.3%-6.4%), 3.9% (1.6%-7.0%), and 2.0% (0.5%-4.5%) variance (parametric 95%-CI) in the task measures as listed in C. Supplementary Table 2 and Extended Data Figure 3 show results separately for discovery and confirmation sample.

