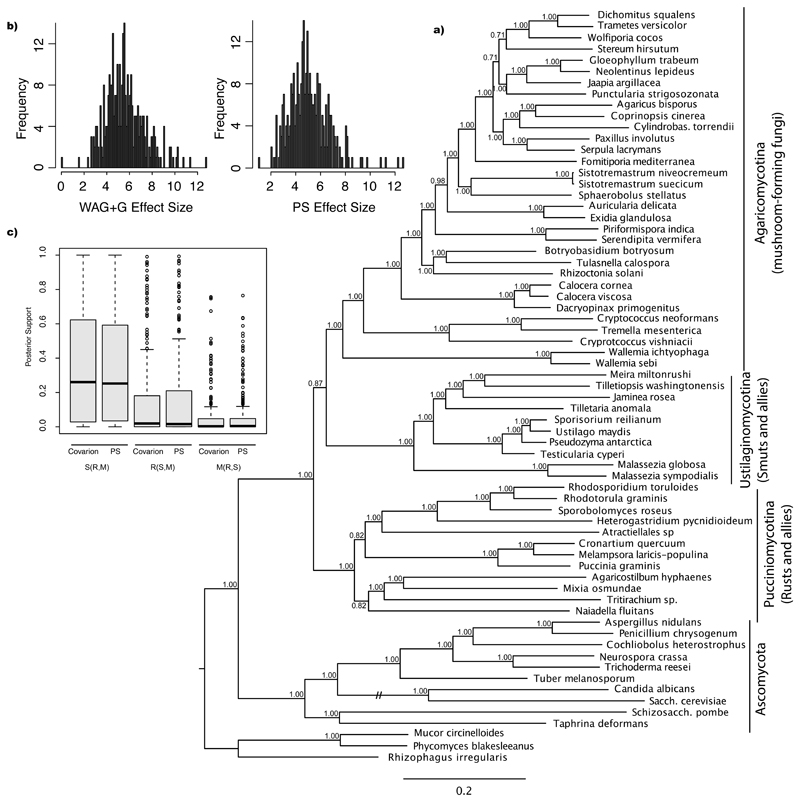
Figure 8.
Absolute model fit and the impact of the implementation of covarion-like models to basal Basidiomycota relationships. a) Distribution of posterior predictive effect sizes representing degree of model violation for WAG+G and Prottest-selected (PS) models. Scatterplot of posterior predictive effect sizes by gene index. The larger the value the poorer the fit between the data and the selected model. The horizontal line represents the median effect size (WAG+G: 5.481, PS: 4.903). b) Distribution of posterior probabilities for S(R,M), R(S,M), and M(R,S) topologies for genes that best fit the covarion model analyzed under the covarion and PS model. c) 50% majority rule consensus tree inferred for the 314G dataset under the covarion-like model.

