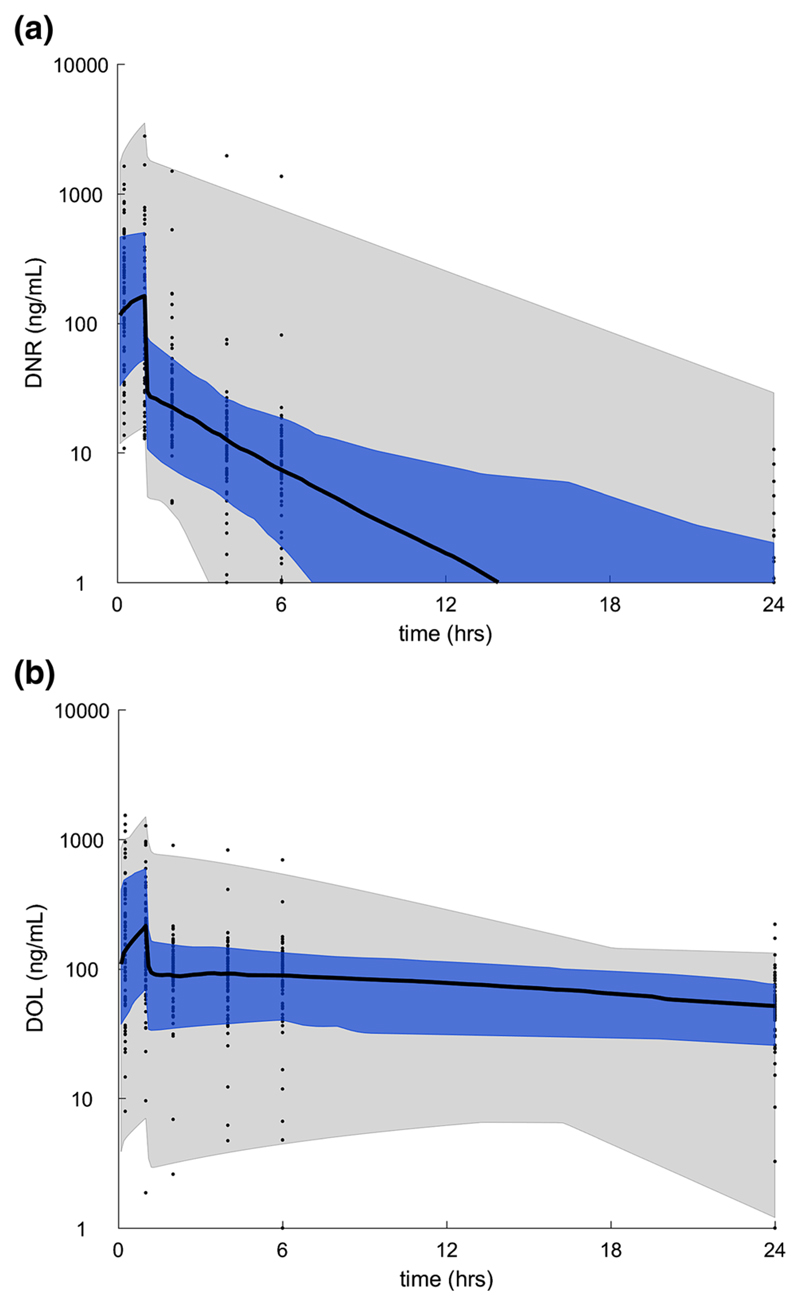
Fig. 1.
Plasma Dnr and DOL PK. Plasma concentration/time curve for (a) Dnr and (b) DOL in AML patients receiving a 60 mg/m2 dose of Dnr. The black curve is the median, the blue shaded region is the 25th–75th percentile, and the gray shaded region is the 5th–95th percentile of the population pharmacokinetics

