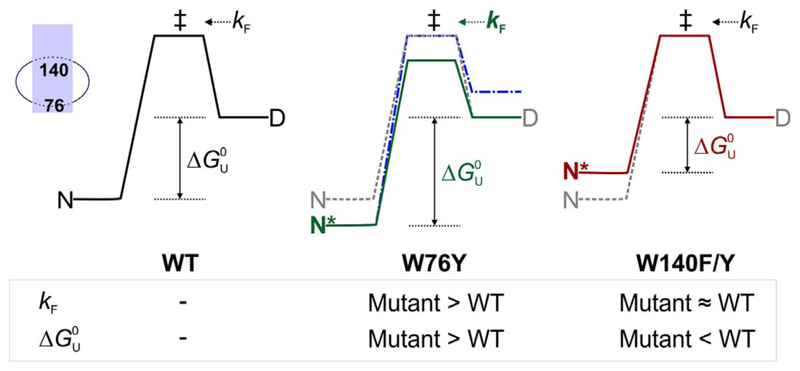
Fig. 6.
Two state diagram depicting possible effects of mutating residues 76 and 140 in an OmpX–DPC micelle assembly. The energy profile for WT (left) and is shown as grey dashed lines in the middle and right profiles. The transition state (‡) bridges the folded (N) and denatured (D) states of OmpX-WT. The measured folding rate k F (D → ‡) increases in W76Y (middle, green, bold) due to a likely change in the height of the transition state (green profile) while it is unaltered in W140F/Y mutations (right). An alternative energy profile where state D changes might also explain the observed increase in k F (middle, blue, dot-dash). The equilibrium folded state of OmpX-W76Y (N*, middle) is more stable than WT, resulting in an overall increase in the Δ of this mutant. OmpX-W140F/Y mutants are destabilized (N*, right, maroon) than WT. The inset (left extreme) shows the positions of residues 76 and 140 in the OmpX-micelle assembly.

