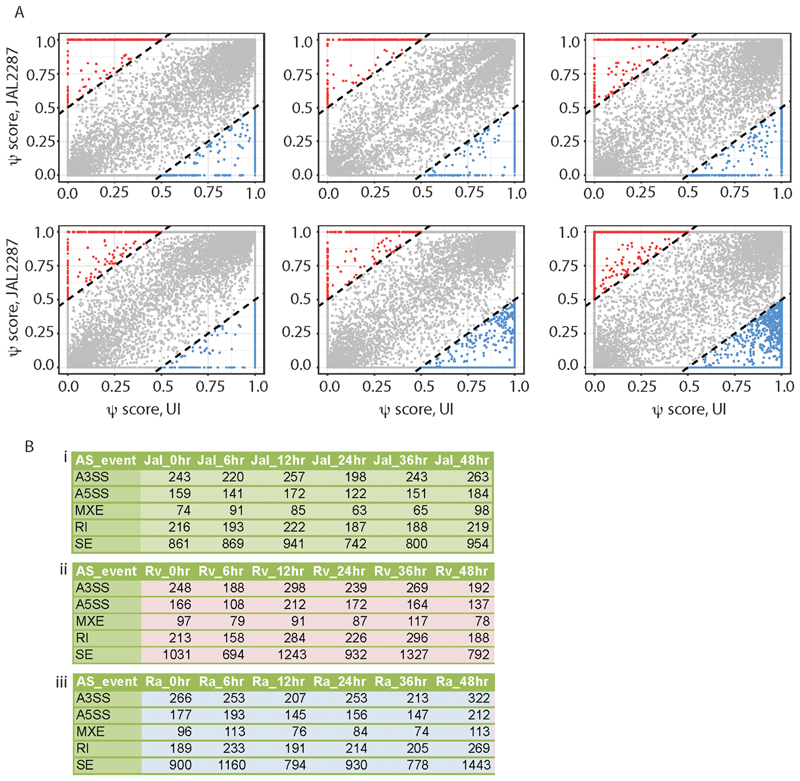
FIG 3.
Estimation of alternate splicing in JAL2287 infected THP-1 macrophages.A. Dot plots for isoform specific psi scores between JAL2287 infected macrophage versus uninfected control plotted for each time point. Each dot represents a single transcript. The dotted lines mark the regions beyond which transcripts had higher psi-score in JAL2287 infected cells by 0.5 or more with respect to uninfected cells (red) or in uninfected cells by 0.5 or more with respect to JAL2287 infected cells (blue). B. Table showing number of significant alternate splicing events where psi-score compared to the uninfected control was higher than 0.5 across (i) JAL2287 (ii) H37Rv, (iii) H37Ra across all time points is shown here. Numbers for H37Rv and H37Ra are reproduced from Kalam et al (25) for comparative analysis. A3SS: alternate 30 splice site, A5SS: alternate 50 splice site, MXE: mutually exclusive exons, RI: retained introns, SE: skipped exons

