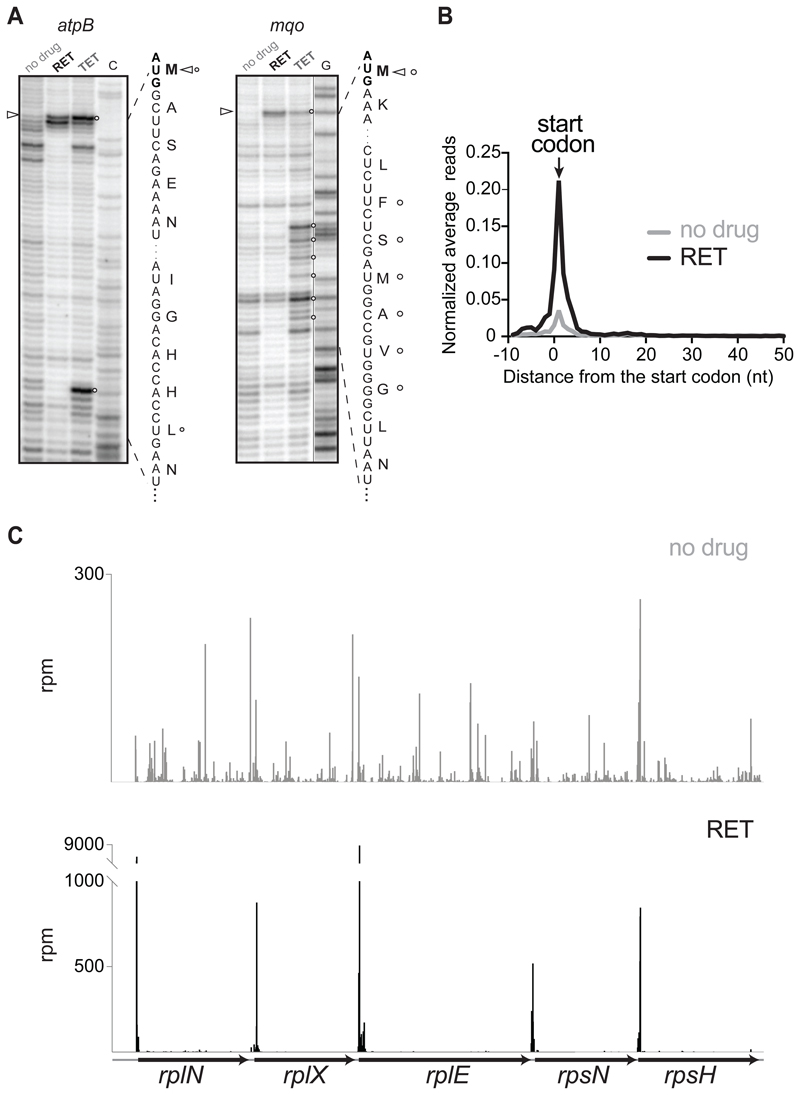
Figure 1. RET specifically arrests ribosomes at translation initiation sites.
(A) Toeprinting analysis showing retapamulin (RET) (triangles)- and tetracycline (TET) (circles)- induced translation arrest sites during cell-free translation of two model E. coli genes. ‘C’ and ‘G’ indicate sequencing lanes. Nucleotide and encoded amino acid sequences are shown.
(B) Metagene analysis plot representing normalized average relative density reads in the vicinity of the annotated start codons of the genes of E. coli cells treated or not with RET.
(C) Ribosome footprints density within the spc operon in cells treated or not with RET.
See also Figures S1.

