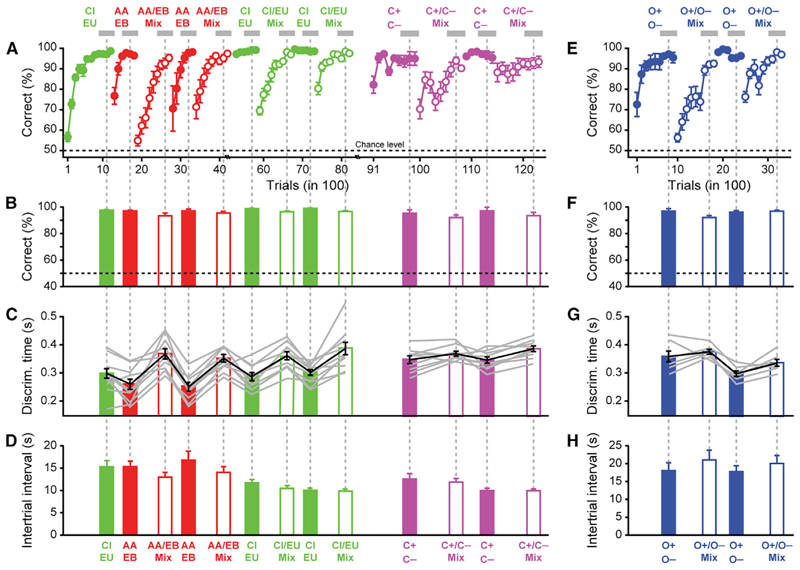
Figure 1. Discrimination Time Varies for Pairs of Odors Belonging to Different Chemical Classes.
(A) Training schedule and accuracies measured for amyl acetate (AA)/ethyl butyrate (EB), cineol (CI)/eugenol (EU), (+)-carvone (C+)/(—)-carvone (C—), and binary mixtures (60-40 versus 40-60). Accuracy of discrimination shown as percentage correct choices of 100 trials. Each data point is the average of nine or ten animals (see STAR Methods). The abscissa reflects the progression of time. Analysis of ODT restricted to the areas highlighted with a gray bar. Odor pairs used were 1% CI versus 1% EU, 1% AA versus 1% EB, 1% C+versus 1% C—, and the mixtures of these odorants as indicated (60-40 mixtures were used; e.g., the AA-EB mix is 0.6% AA + 0.4% EB versus 0.4% AA + 0.6% EB; all odor pairs were counterbalanced as described in STAR Methods).
(B) Accuracy corresponding to experimental blocks indicated in (A) (gray bars).
(C) ODTs for individual mice and for the population (gray and black lines, respectively), averaged for the same period as in (B) are larger for pairs of binary mixtures than for the pairs of monomolecular odorants (between AA-EB and their binary mixtures: one-way RM ANOVA, F = 31.2, p = 6.4 x 10⁻⁹, n = 10 mice; CI-EU and their binary mixtures: one-way RM ANOVA, F = 17.5, p = 4.7 x 10⁻⁸, n = 10 mice; C+/C- and their binary mixtures: one-way RM ANOVA, F = 3.4, p = 0.03, n = 9 mice).
(D) ITI as a measure of motivation is independent of odor similarity (AA-EB, CI-EU and their binary mixtures: R2 = 0.2, ANOVA F = 1.8, p = 0.2, n = 10 mice; C+/C- and their binary mixtures: R2 = 0.1, ANOVA, F = 0.6, p = 0.4, n = 9 mice).
(E) Training schedule for octanols and binary mixtures. Accuracy of discrimination shown as percentage correct choices of 100 trials. Each data point is the average of seven animals (different from animals shown in A). The abscissa reflects the progression of time. Odor pairs used were 0.1% O+ versus 0.1% O— and mixtures of O+ and O— (0.06% O+ and 0.04% O— versus 0.04% O+ and 0.06% O—).
(F) Accuracy (averaged for the period indicated by gray bars in E).
(G) ODTs corresponding to experimental blocks indicated in (E) (one-way RM ANOVA, F = 9.2, p = 6.3 x 10⁻⁴, n = 7 mice).
(H) ITI interval for octanols and binary mixtures tasks (R2 = 0.4, ANOVA, F = 1.4, p = 0.4, n = 7 mice).Data are presented as mean ± SEM.

