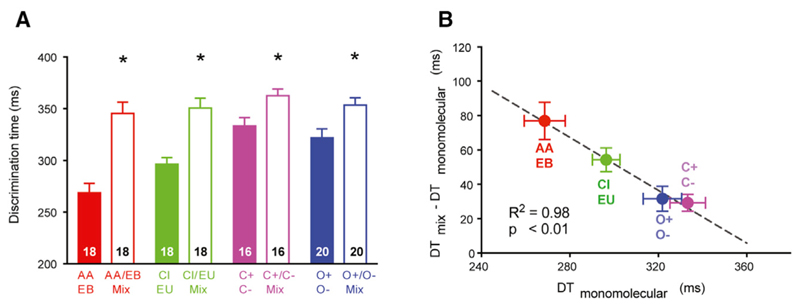
Figure 2. Comparison of ODTs for Simple Monomolecular Odorants and Complex Binary Mixtures across Different Classes of Chemicals.
(A) Average ODTs across different experiments. Data are presented as mean ± SEM. DTaa/Eb = 269 ± 9 ms, DTAA/EBmix = 346 ± 11 ms, DTci/eu = 296±6ms, DTCI/EUmix = 351 ±9ms, DTc+/c- = 333 ± 8 ms, DTc+/c-mix = 363 ± 7 ms, DTo+/o- = 322 ± 9 ms, DTc+/c-mix = 353 ± 7 ms. Number of animals is indicated on each bar. ‘Comparison of ODTs for monomolecular odorants versus binary mixtures: ANOVA, F = 12.81, p < 0.0001; Fisher’s LSD, p < 0.05.
(B) Delta ODT for binary mixtures and associated monomolecular odorants is inversely related to ODT for monomolecular odorants (linear regression: R2 = 0.98; ANOVA, p < 0.01). Data are presented as mean ± SEM

