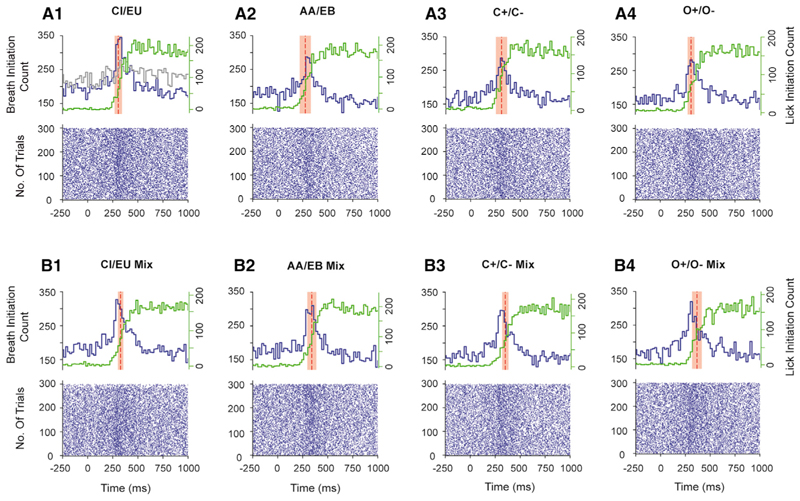
Figure 4. Sniffing, Licking, Decision-Making, and ODT under Head-Restrained Conditions.
(A1-B4) Bottom half of each panel (raster plots of A1-B4) shows the breathing cycle pattern of the mice during the last task of training, when performance accuracy was ~90%. Each point on the raster represents the start of inhalation. Top half of each panel (A1-B4) shows a histogram taken from all trials using a bin size of 20 ms (i.e., adding up the number of breathing cycles initiated within 20 ms across all trials). The red dotted line and shaded region represent the mean ODT ± SD. The histograms for each odor pair have been compared with the MO versus MO. The MO histogram trace is shown for comparison in (A1) (gray line). Comparison between the odor and MO histograms was done using the Kolmogorov-Smirnov (K-S) test (p < 0.0001 for all odor pairs). Green traces represent the histogram of licking onset in response to odorants. K-S test comparing breath initiation count histograms and lick initiation count histograms: p < 0.0001 for all odor pairs. See also Figures S3 and S4.

