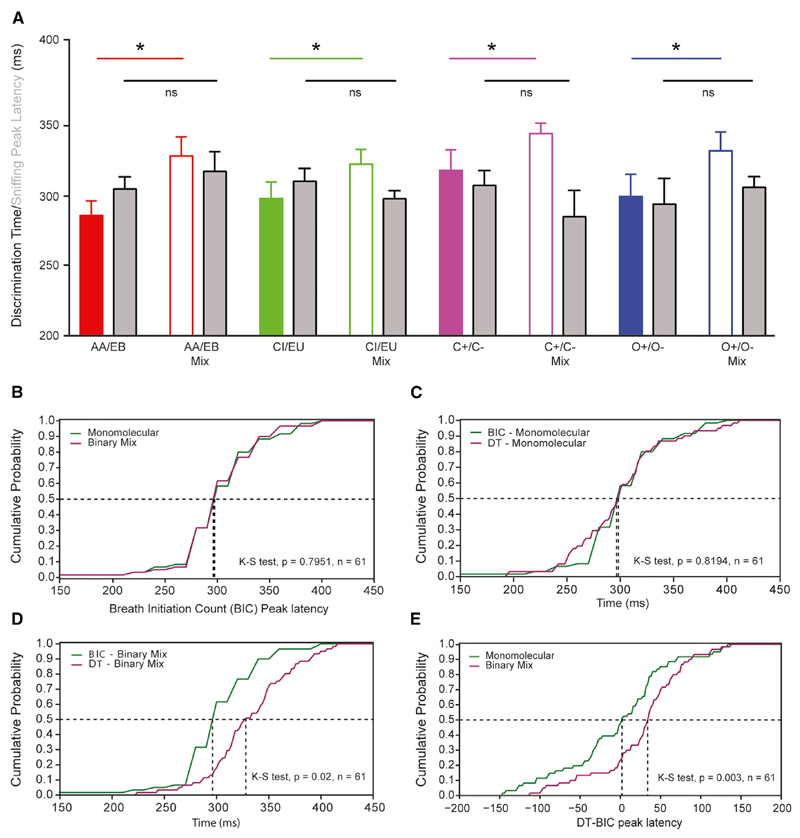
Figure 5. Sniff-Invariant Odor Discriminations for Odor Pairs of Varying Complexity.
(A) Comparison between ODTs and SPL for odor pairs of varying similarity. Colored (filled and empty) bars are ODTs, gray bars represent the sniffing peak latency values for the corresponding ODTs. Data are presented as mean ± SEM. DTAA/EB = 286 ± 11 ms, DTAA/EBmix = 328 ± 14 ms, DTCI/EU = 298 ± 12 ms, DTCI/EUmix = 322 ± 11 ms, DTC+/C- = 318 ± 15 ms, DTC+/C-mix = 344 ± 7 ms, DTO+/O- = 299 ± 16 ms, DTO+/O-mix = 332 ± 13 ms, sniffing PAA/EB = 305 ± 9 ms, sniffing PAA/EBmix = 317 ± 14 ms, sniffing PCI/EU = 310 ± 9 ms, sniffing PCI/EUmix = 298 ± 6 ms, sniffing PC+/C- = 307 ± 11 ms, sniffing PC+/C-mix = 285 ± 19 ms, sniffing PO+/O- = 294 ± 18 ms, sniffing PO+/O-mix = 306 ± 8 ms. Comparison between ODTs for monomolecular odorants and associated binary mixtures: paired t test, p < 0.05. Comparison between sniffing peak latency for simple odors and associated binary mixtures: paired t test, p > 0.05.
(B) The SPL compared between monomolecular odors and binary mixtures by pooling all odor pairs. The SPL remains unaltered for monomolecular odors and binary mixtures (K-S test, p = 0.8; n = 61).
(C and D) Comparison between cumulative probability distributions of ODT and SPL for monomolecular odors and binary mixtures. Additional time is required to discriminate binary mixtures (compared with SPL, D; K-S test, p = 0.02; n = 61), but ODTs and SPL remain unaltered for monomolecular odors (C; K-S test, p = 0.82; n = 61).
(E) The difference between SPLs and ODTs for monomolecular odors and binary mixtures represented by cumulative probability distributions. The difference is greater for binary mixtures compared with monomolecular odors (K-S test, p = 0.003; n = 61). See also Figures S5-S7.

