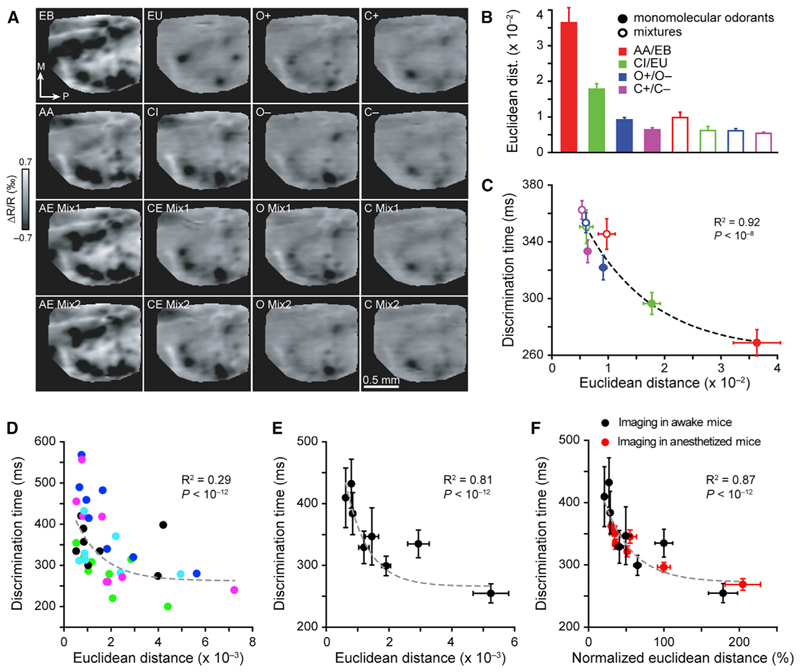
Figure 6. The Euclidean Distance between Odor-Activated Glomerular Maps in Naive and Awake Trained Mice Correlates with Discrimination Times Measured for Corresponding Odor Pairs.
(A) IOS imaging of glomerular maps elicited by four pairs of monomolecular odors and their binary mixtures used in the behavioral training.
(B) Euclidean distance (ED; see STAR Methods) between activation patterns evoked by different odor pairs (comparison between monomolecular odorants and binary mixtures: paired t test, p < 0.0005, n = 5 mice).
(C) Discrimination times measured for monomolecular odorants and binary mixtures are plotted as a function of Euclidean distance between maps of activation patterns for corresponding odor pairs. Data were best fitted with a single exponential function (R2 = 0.96, ANOVA, p < 10–12) (see STAR Methods).
(D) ODTs measured during different discrimination tasks (10–6 IAA versus 10–6 EB, 10–4 IAA versus 10–4 EB, 10–2 IAA versus 10–2 EB, 100 IAA versus 100 EB, 10–3 CI versus 10–3 EU, 10–2 CI versus 10–2 EU, 10–1 CI versus 10–1 EU, 100 CI versus 100 EU) are plotted against the Euclidean distances measured for the corresponding odor pairs for individual mice (R2 = 0.29, ANOVA, p< 10–12). Dilutions were used to generate sparse representations in the OB. Colors indicate data collected for each individual mouse (n = 5).
(E) ODTs and Euclidean distance measured are averaged across mice (R2 = 0.81, ANOVA, p < 10–12, n = 5 mice).
(F) ODTs measured for 16 odor pairs are plotted as a function of normalized Euclidean distance, from both awake and anesthetized mice (normalized to 100 CI versus 100 EU, which was common to both sets of experiments [R2 = 0.75, p < 10–12, n = 10 mice]). Data are presented as mean ± SEM.

