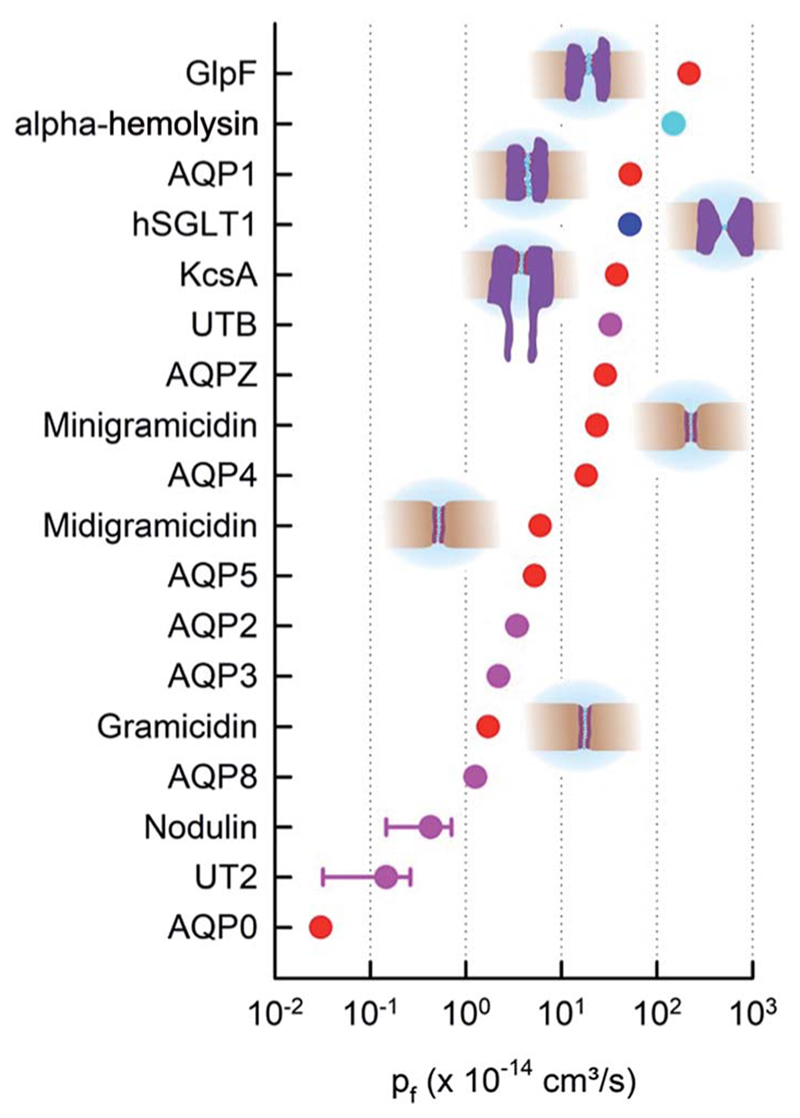
Fig. 2.
The p f values of membrane channels and transporters. The red and pink dots indicate pores with a known single-file region. Whether the sodium-glucose cotransporter SGLT1 (blue) has a single-file region is not entirely clear. The beta-barrel α-hemolysin (cyan) accommodates multiple water molecules in its cross-section.35 Moreover, red and blue dots indicate quantitative p f measurements in terms of protein counting. hSGLT1,36 KcsA, GlpF, AQP1, AQPZ,22 AQP4,37 and AQP538 were counted with fluorescence correlation spectroscopy (FCS). The bacterial cation selective gramicidin channels39 were measured electrically and AQP0 (ref. 40) with electron microscopy (EM). AQP8 (ref. 41) is also permeable to ammonia and urea. Vice versa, urea transporters Ut-B and UT-2 are permeable to water.42

