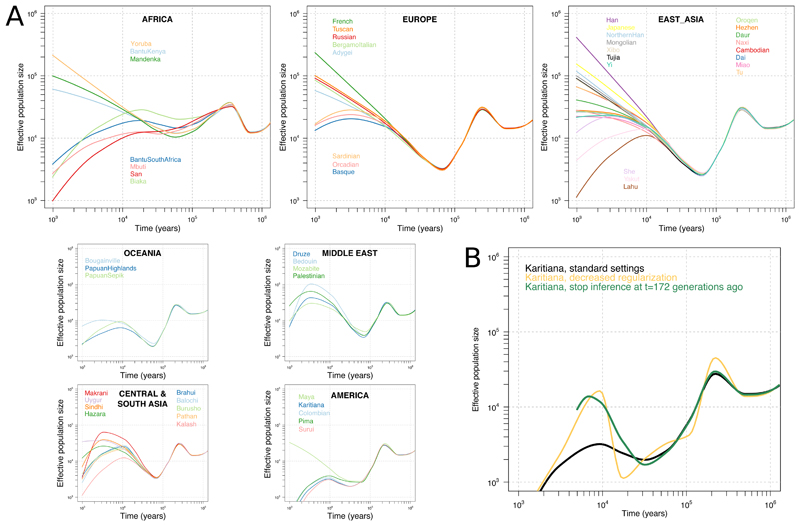
Figure 4. Effective population size histories of 54 diverse populations.
(A) Effective population sizes for all populations inferred using SMC++, computed using composite likelihoods across six different distinguished individuals per population. Our ability to infer recent size histories in some South Asian and Middle Eastern populations might be confounded by the effects of recent endogamy. (B) Results for the Native American Karitiana population with varying SMC++ parameter settings. Decreasing the regularization or excluding the last few thousand years from the time period of inference leads to curves displaying massive growth approximately in the period 10 to 20 kya.

