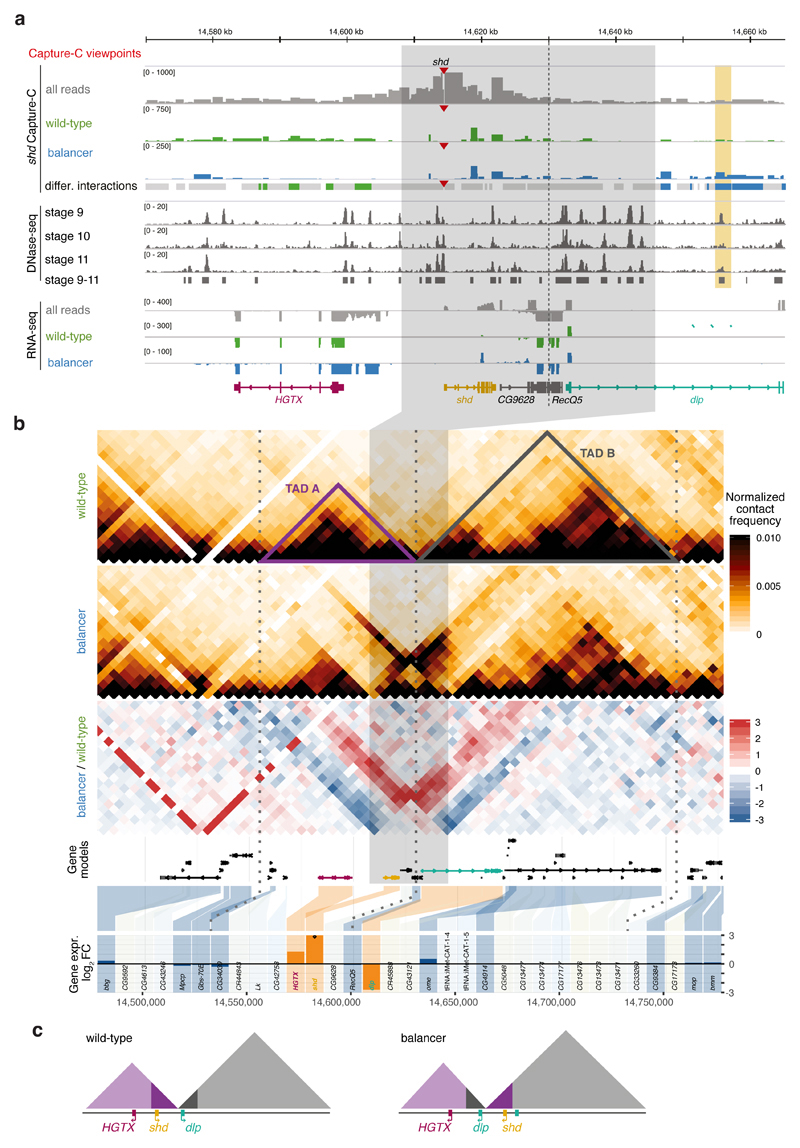
Figure 6. Chromatin organization and expression around a 38kb inversion.
a, Top to bottom: Capture-C tracks (all reads (grey), wild-type-specific (green), and balancer-specific (blue) reads) for the shd viewpoint (red triangle) in the vicinity of a balancer-specific inversion in chr3L (grey highlight). Dashed vertical line indicates the TAD boundary. Differential Capture-C contacts stronger in wild-type (green), balancer (blue), or not significantly changed (grey) are highlighted. DHS signal at stages 9-11, RNA expression (all reads and allele-specific) and gene models shown underneath. A differential contact is formed between the shd promoter and a DHS (vertical orange rectangle) in the balancer haplotype, observed in two independent Capture-C experiments. b, Top to bottom: Wild-type and balancer Hi-C contact maps, log2 fold change before normalization (balancer/wildtype, red/blue), gene models, and differential gene expression (balancer/wildtype, log2 fold change). Differentially expressed (DE) genes in orange, non-DE genes in blue and non-tested genes (lowly expressed or lacking SNVs) in grey. Dotted vertical lines indicate TAD boundaries. c, Model of the inversion and associated changes in TAD structure and position of three DE-genes in the balancer haplotype.

