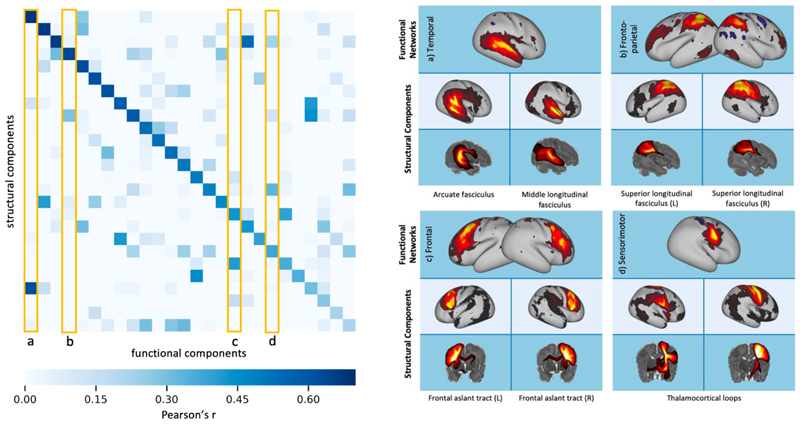
Figure 10.
Left: correlation matrix between the fMRI RSNs and their 26 best-matched tractography NMF components. Right: examples of the functional networks and their most spatially similar grey matter components from structural NMF. These correspond to the columns outlined in yellow on the correlation matrix. The corresponding white matter patterns are shown as maximum intensity projections.

