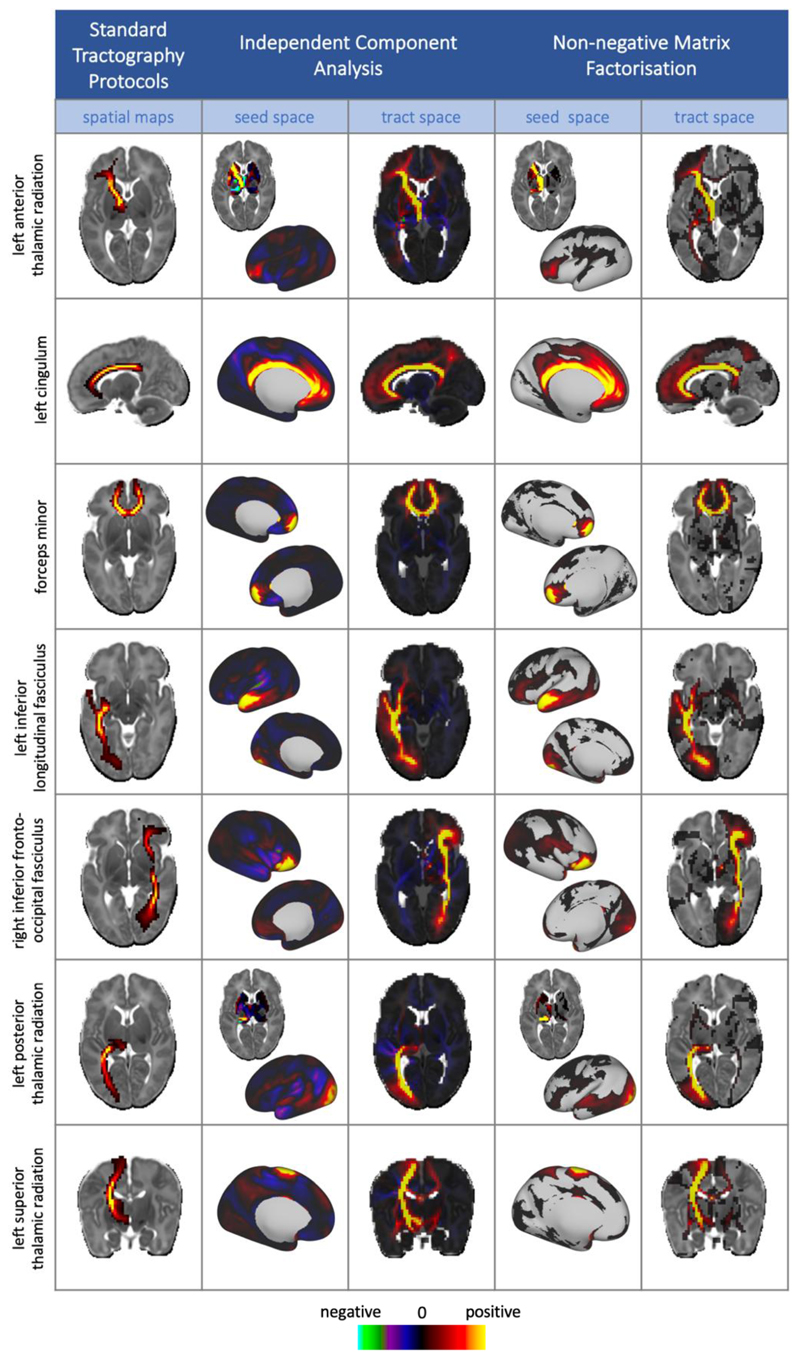
Figure 6.
Example group level results from NMF and ICA (model order = 100), displayed alongside their matching tract from the standard protocols. Data-driven components are un-thresholded to enable the comparison between the negative values in the ICA components and the sparse, non-negative representations from NMF, whereas the maps from standard protocols are lowerthresholded at 0.001 for clearer visualisation of the tract. All tractography and data-driven results are taken from split 1 of the split-half analysis. The full set of 28 tracts with their matched data-driven components are shown in the supplementary material.

