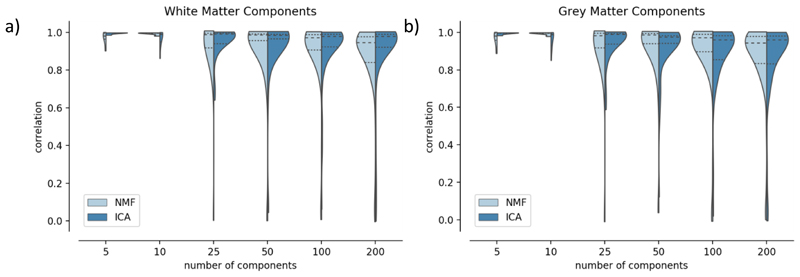
Figure 8.
Split-half reliability analysis for ICA and NMF. Pearson’s correlation scores were calculated between the best-matched components in each split for the white matter spatial maps (a) and the grey matter maps (b). The dotted lines on the violin plots indicate the 25th and 75th percentiles and the median is represented by a dashed line.

