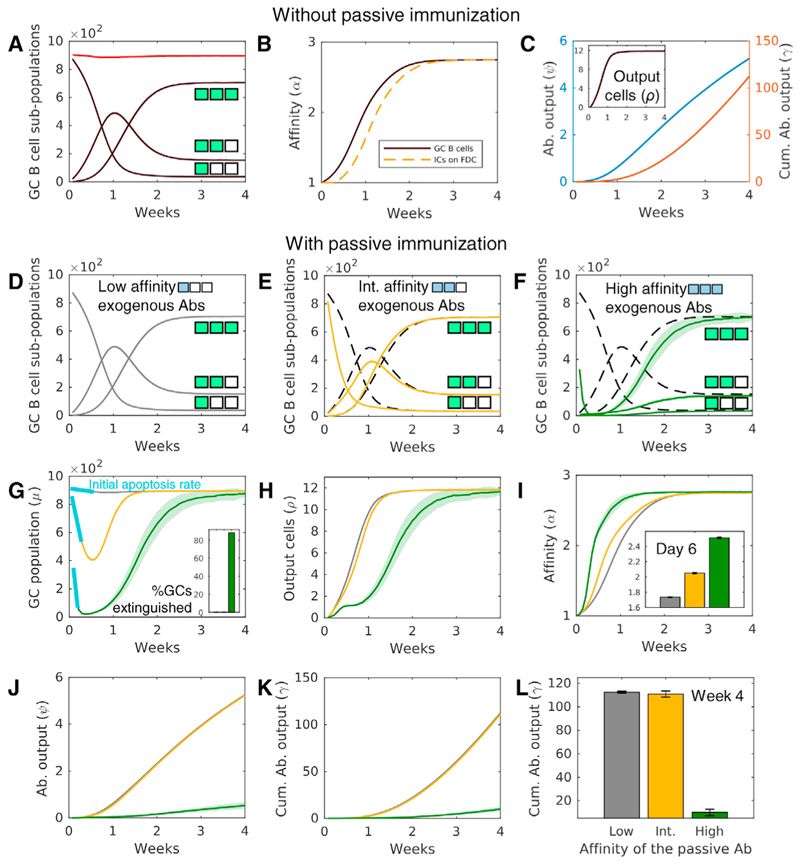
Figure 2. Passive Immunization Alters Affinity Maturation and the Quality-Quantity Trade-Off Constraining the GCR.
(A–C) Natural AM. Temporal evolution of (A) low- (ε = 1), intermediate- (ε = 2), and high (ε = 3)-affinity GC B cell sub-populations and overall GC size, μ(t) (red); (B) the average affinity of GC B cells (black) and of the Abs in ICs (dashed orange); and (C) the plasma cell output (inset), instantaneous Ab production from GCs, and the cumulative Ab output from GCs. The match length, e, is illustrated with colored positions in box strings.
(D-K) AM with passive immunization. Evolution of GC B cell sub-populations upon passive immunization with Abs of (D) low (ω = 1, gray), (E) intermediate (ω = 2, yellow), or (F) high (ω = 3, green) affinity is shown. Dashed lines represent natural AM, shown for comparison. The match lengths are illustrated with green (endogenous) or blue (exogenous) colored positions in box strings. Temporal evolution of GC attributes upon immunization with low- (gray), intermediate- (yellow), and high (green)-affinity Abs is as follows: (G) size (μ(t); % GCs extinguished over the course of 4 weeks shown in inset and initial apoptosis rates in blue); (H) plasma cell output (ρ(t)); (I) affinity (α(t)); (J) instantaneous Ab output (ψ(t)); and (K) overall Ab output (γ(t)).
(L) Comparison of λ at week 4 shows that intermediate affinity Abs maximized the quality-quantity trade-off. Lines and bars represent meansof50 ensemble means, with each ensemble comprising 100 realizations, and shaded regions and error bars represent SEMs STAR Methods.
See also Figures S1 and S2.

