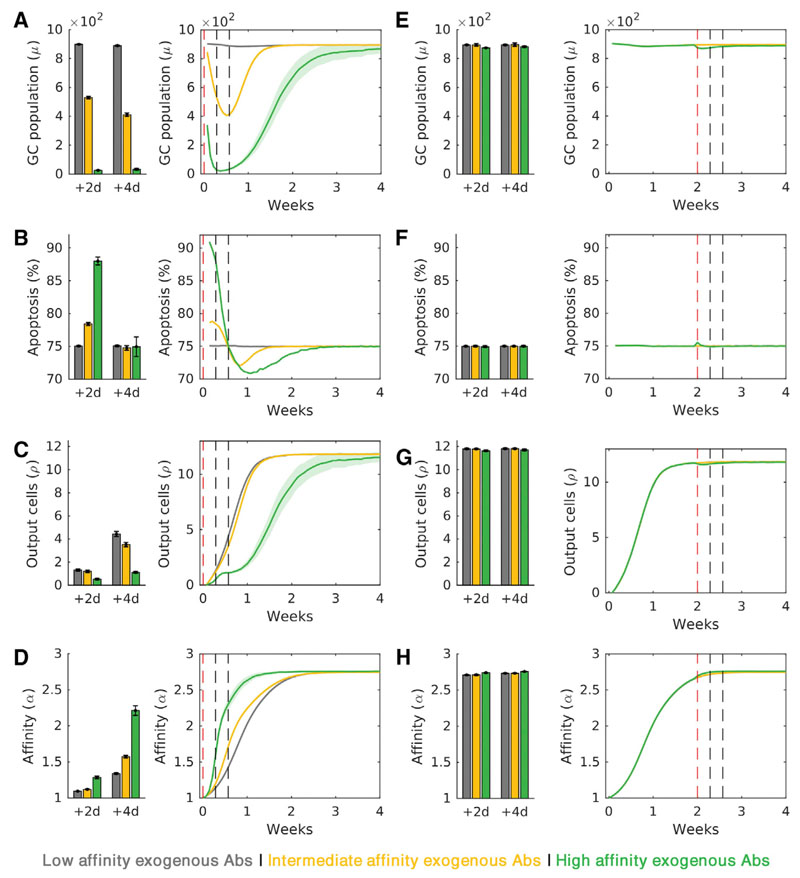
Figure 3. Simulations Recapitulate Experiments of the Quality-Quantity Trade-Off.
(A-H) Point measurements (left; 2 and 4 days after passive immunization) and temporal evolution of GC attributes (right), after (A-D) immunization with GC initiation and (E-H) immunization 2 weeks after GC initiation. Attributes include GC size (A and E), extent of apoptosis (B and F), plasma cell output (C and G), and affinity (D and H). Red and gray vertical dashed lines in all the temporal trends indicate the times of passive immunization and measurement of GC characteristics, respectively. The results are consistent with recent experimental observations (Zhang et al., 2013). Shaded regions and error bars represent SEMs.

