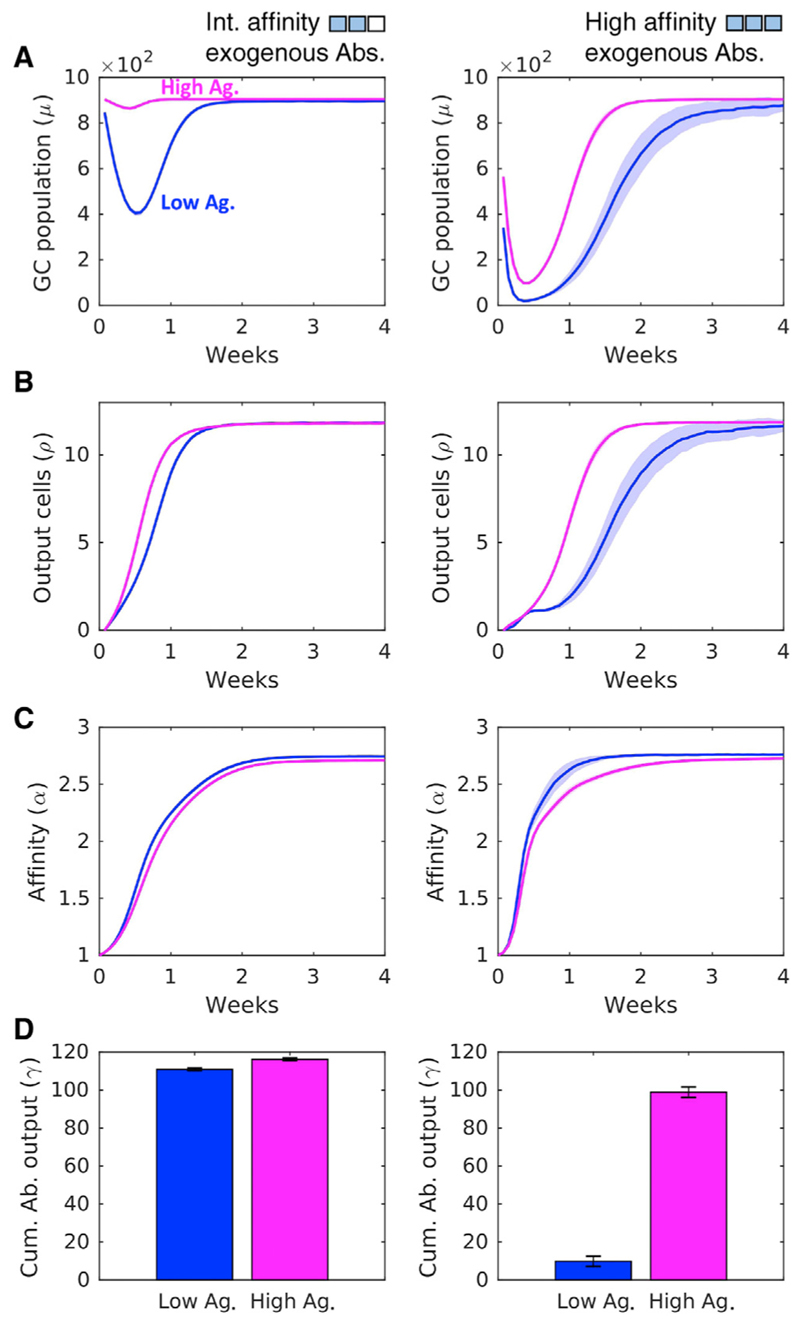
Figure 4. Ag Availability Tunes the Quality-Quantity Trade-Off in the GCR.
(A-D) GC characteristics: (A) size; (B) plasma cell output; (C) affinity of GC B cells; and (D) cumulative Ab output at week 4 upon passive administration of exogenous Abs with intermediate (left column) and high (right column) affinity for Ag under low (η = 10, blue) and high (η = 14, magenta) Ag availability regimes. Shaded regions and error bars represent SEMs. See also Figure S3.

