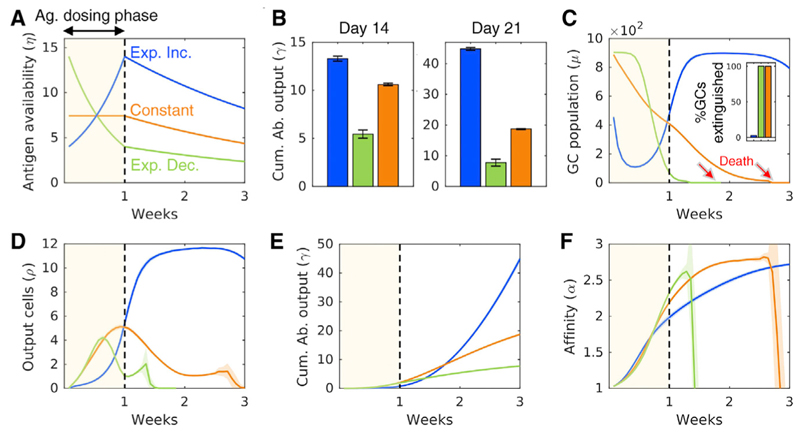
Figure 5. Simulations Recapitulate Experiments with Varying Ag Availability.
(A)Time evolution of Ag availability, η (see text), mimicking the exponentially increasing, constant, or exponentially decreasing Ag dosage till day 7 (Ag dosing phase) and exponential decline afterward. The latter decline occurs with the rate constant of 0.018 generation-1 (ICs on FDCs are lost by turnover with an estimated rate constant of 0.012 generation-1; Tam et al., 2016; Kepler and Perelson, 1993. We let an additional 50% loss occur, as an approximation, due to Ag acquisition by B cells.).
(B)GC responses elicited by the three Ag dosing profiles in terms of the cumulative Ab output on day 14 and day 21.
(C-F) Temporal evolution of the GC size (% GCs extinguished by week 3 in inset) (C), plasma cell output (D), cumulative Ab output (E), and GC B cell affinity (F), respectively. The results are consistent with corresponding experiments (Tam et al., 2016). Shaded regions and error bars represent SEMs.

