Figure 3.
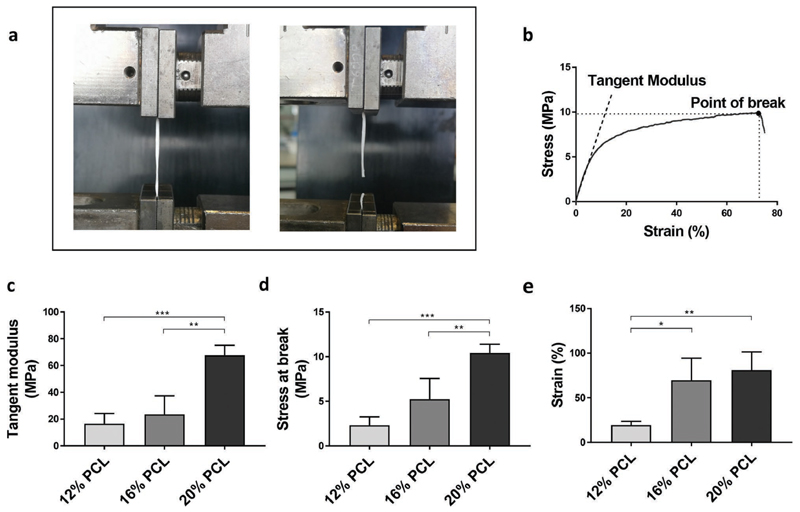
Mechanical scaffold properties. a) Experimental set-up for uniaxial tensile testing. b) Representative stress-strain curve for a 20% PCL scaffold with indicated tangent modulus and point at break. c) Comparison of tangent moduli (n = 3). d) Comparison of stress at break (n = 3). e) Comparison of strain at break (n = 3). Data are expressed as mean ± SD. *p < 0.05, **p < 0.01, ***p < 0.001 using one-way ANOVA.

