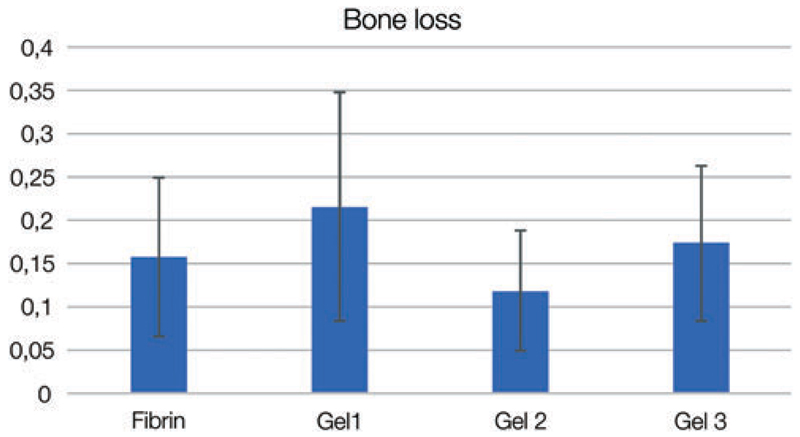
Fig. 2.
Bone volume loss from study 1. The area beneath the defects and healthy adjacent tissue was scanned postmortem with micro-CT imaging. Images obtained were processed with ImageJ to obtain bone volume values before and after implantation. Statistical analysis showed no correlation of bone loss with any of the materials. micro-CT, microcomputed tomography. Color images available online at www.liebertpub.com/tec

