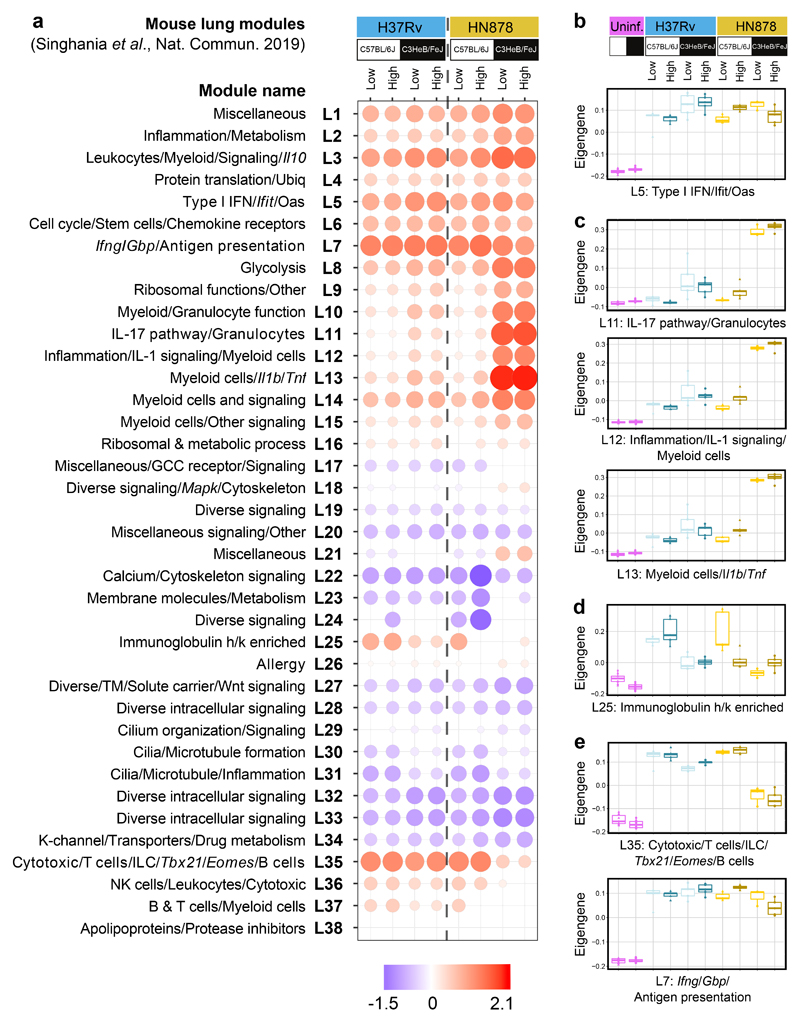
Figure 2. Mouse lung disease modules tested in lungs from diverse mouse TB models.
a, Mouse lung disease modules derived in Singhania et al. 201941 (L1-L38) tested in mouse lung TB samples from different genetic strains of mice (C57BL/6J, resistant; C3HeB/FeJ, susceptible) infected with low and high doses of M. tuberculosis laboratory strain H37Rv or the M. tuberculosis clinical isolate HN878 (n=3 biologically independent samples per group for low dose HN878 infection of C3HeB/FeJ, and n=5 biologically independent samples per group for all other groups as depicted in Supplementary Fig. 1a), compared to their respective uninfected controls (Supplementary Table 4). Red and blue indicate modules over- or under-abundant, compared to the controls. Colour intensity of the dots represents the degree of perturbation, indicated by the colour scale. Size of the dots represents the relative degree of perturbation, with the largest dot representing the highest degree of perturbation within the plot. Only modules with fold enrichment scores with FDR p-value < 0.05 were considered significant and depicted here. GCC, glucocorticoid; K-channel, potassium channel; TM, transmembrane; Ubiq, ubiquitination. b-e, Box plots depicting the module eigengene expression, i.e. the first principal component for all genes within the module, are shown for uninfected (Uninf) and M. tuberculosis infected (Low dose; High dose) C57Bl/6 and C3HeB/FeJ mice, for modules (b) Type I IFN/Ifit/Oas (L5); (c) IL-17 pathway/granulocytes (L11), Inflammation/IL-1 signaling/Myeloid cells (L12), Myeloid cells/Il1b/Tnf (L13); (d) Immunoglobulin h/k enriched (L25); (e) Cytotoxic/T cells/ILC/Tbx21/Eomes/B cells (L35) and Ifng/Gbp/Antigen presentation (L7).

