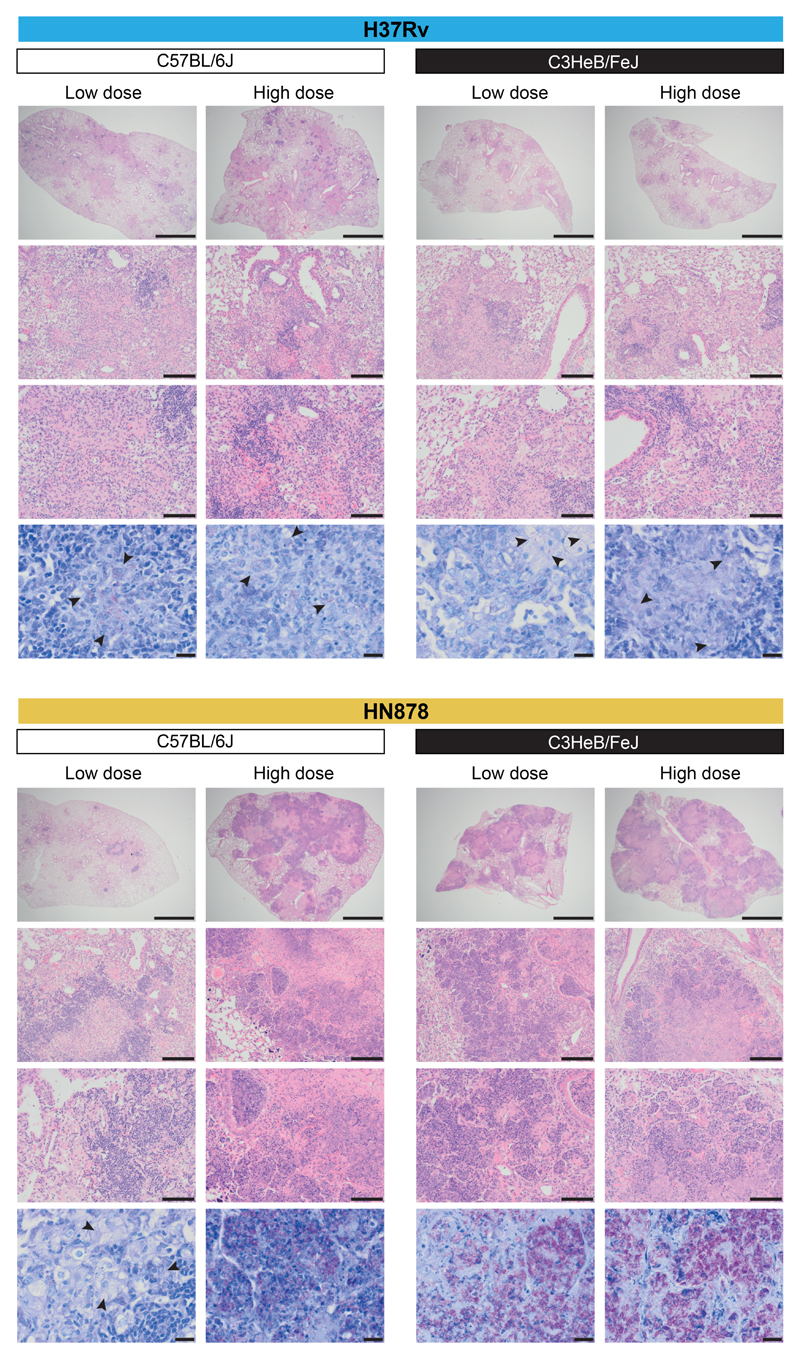
Figure 3. Histological analysis of mouse lungs from M. tuberculosis infected mice.
Representative photomicrographs of hematoxylin and eosin (H&E) or Ziehl–Neelsen (ZN) stained lung sections from different genetic strains of mice (C57BL/6J, resistant; C3HeB/FeJ, susceptible) infected with low and high doses of M. tuberculosis laboratory strain H37Rv or the M. tuberculosis clinical isolate HN878 (n=2 biologically independent samples per group for H37Rv infection, HN878-infected C57BL/6J mice low dose and HN878-infected C3HeB/FeJ mice high dose, and n=3 biologically independent samples per group for HN878-infected C57BL/6J mice high dose and HN878-infected C3HeB/FeJ mice low dose, from one experiment per M. tuberculosis infection). From top to bottom, scale bar represents 2 mm, 200 μm and 100 μm for H&E staining, 20 μm for ZN staining; arrows locate bacteria.

