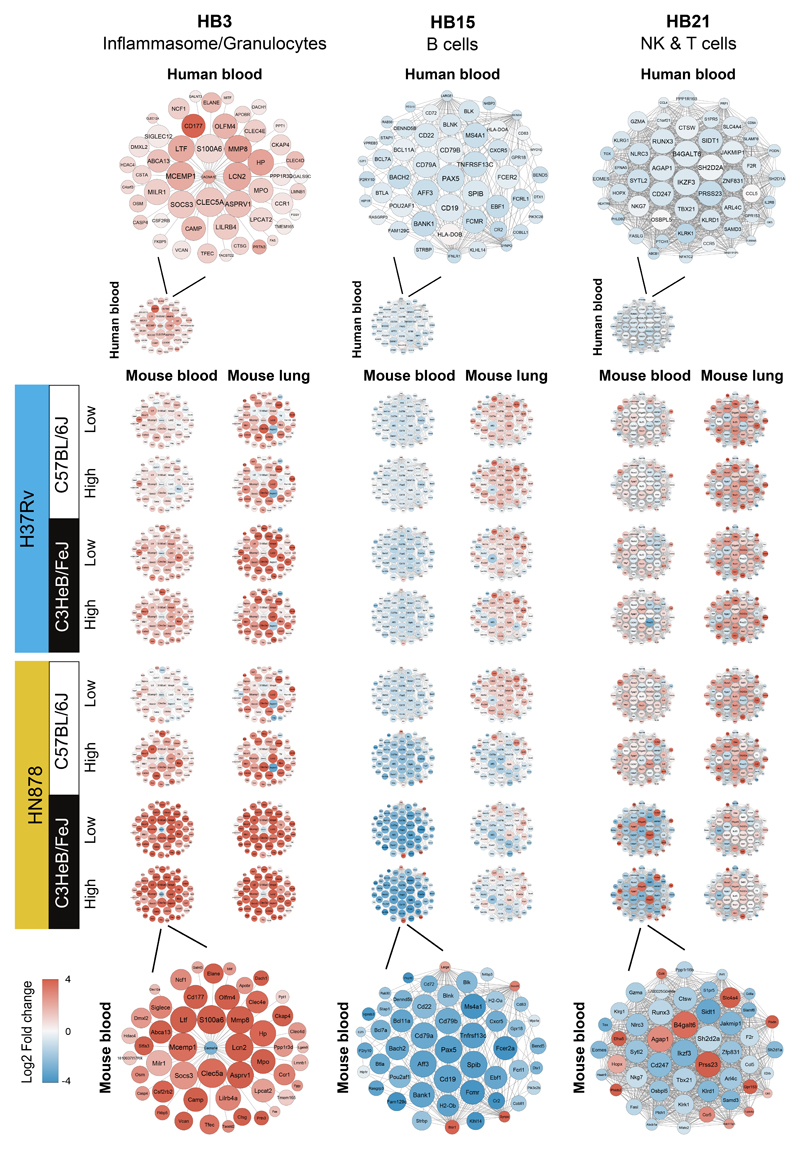
Figure 4. Gene networks of specific TB modules in human blood from TB patients, and blood and lung from M. tuberculosis infected mice.
Differential expression of genes from human blood modules Inflammasome/Granulocytes (HB3), B cells (HB15) and NK & T cells (HB21) depicting the top 50 “hub” network of genes with high intramodular connectivity found within the mouse data (i.e., mouse genes most connected with all other genes within the module), is shown for data from blood from TB patients (Leicester cohort), and blood and lungs from mice infected with M. tuberculosis, each against their respective controls. An enlarged representative network showing human gene names is shown for human blood (top) and an enlarged representative network showing mouse gene names is shown for blood samples from C3HeB/FeJ mice infected with high dose of HN878 (bottom). Each gene is represented as a circular node with edges representing correlation between the gene expression profiles of the two respective genes. Colour of the node represents log2 foldchange of the gene for human blood TB samples or mouse blood and lung samples from M. tuberculosis infected mice compared to respective controls.

