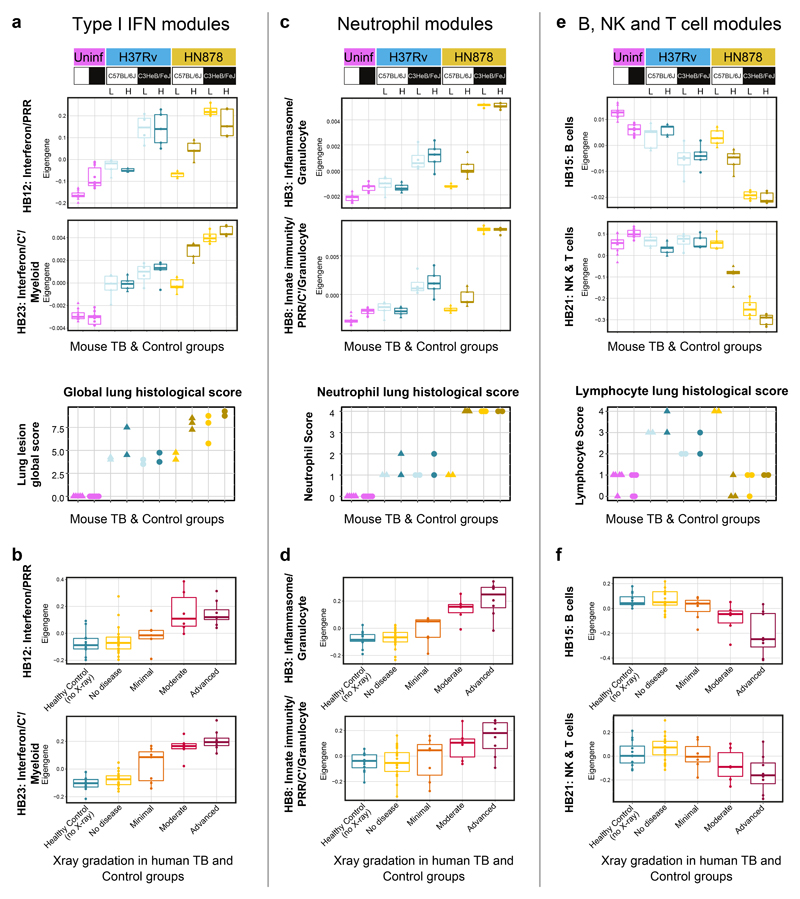
Figure 6. Quantitation of specific blood modular signatures against extent of lung pathology in mouse models and human TB.
Box plots depicting the module Eigengene expression for human blood modules Interferon/PRR (HB12) and Interferon/C’/Myeloid (HB23) (a, b), Inflammasome/Granulocytes (HB3) and Innate immunity/PRR/C’/ Granulocytes (HB8) (c, d), B cells (HB15) and NK & T cells (HB21) (e, f), are shown for mouse blood samples from uninfected (Uninf; n = 5 biologically independent samples per group) and M. tuberculosis H37Rv or HN878 infected (L, low dose; H, high dose) C57Bl/6 and C3HeB/FeJ mice (n=3 biologically independent samples per group for low dose HN878 infection of C3HeB/FeJ, and n=5 biologically independent samples per group for all other groups as depicted in Supplementary Fig. 1a) (a, c, e); and for human blood samples from the London TB cohort divided in Healthy Control (no X-ray; n=12 biologically independent samples) and TB patients grouped according to the radiographic extent of disease as No disease (n=21 biologically independent samples), Minimal (n=7 biologically independent samples), Moderate (n = 6 biologically independent samples) or Advanced (n=8, biologically independent samples, described in Berry et al. 20109) (b, d, f). Lung lesion global score (a), neutrophil (c) and lymphocyte (e) scores from H&E stained lung sections are also shown for uninfected (Uninf, n=5 biologically independent samples per group) and M. tuberculosis H37Rv or HN878 infected (L, low dose; H, high dose) C57Bl/6 and C3HeB/FeJ mice (n=2 biologically independent samples per group for H37Rv infection, HN878-infected C57BL/6J mice low dose and HN878-infected C3HeB/FeJ mice high dose, and n=3 biologically independent samples per group for HN878-infected C57BL/6J mice high dose and HN878-infected C3HeB/FeJ mice low dose, from one experiment per M. tuberculosis infection).

