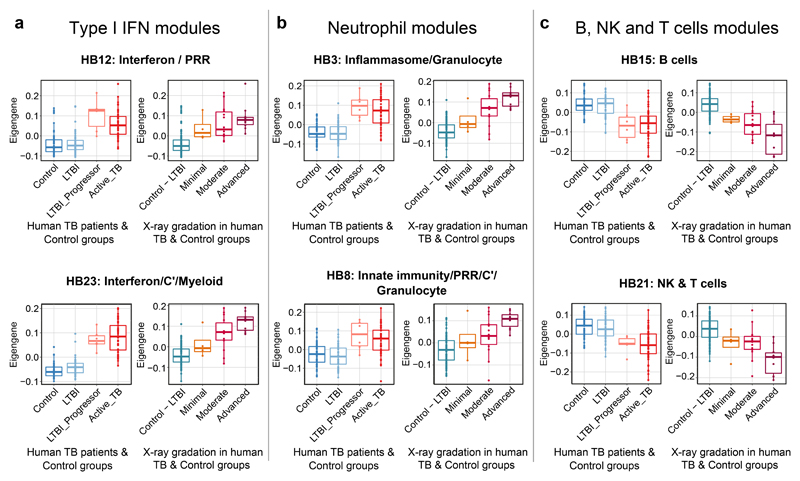
Figure 7. Quantitation of specific blood modular signatures in blood of healthy controls, LTBI, LTBI-progressors and active TB patients.
Box plots depicting the module Eigengene expression for human blood modules Interferon/PRR (HB12) and Interferon/C’/Myeloid (HB23) (a), Inflammasome/Granulocytes (HB3) and Innate immunity/PRR/C’/ Granulocytes (HB8) (b), B cells (HB15) and NK & T cells (HB21) (c), are shown for human blood samples from the Leicester TB cohort divided in Control (IGRA-ve TB contacts who remained healthy; n=50 biologically independent samples), LTBI (IGRA+ve TB contacts who remained healthy; n=49 biologically independent samples), LTBI_Progressor (TB contacts who developed TB, time point just before the contact was diagnosed with active TB; n=6 biologically independent samples) and Active_TB (patients with active disease; n=53 biologically independent samples) (left panels) or divided in Control – LTBI (IGRA-ve and IGRA+ve TB contacts who remained healthy) or TB patients grouped according to the radiographic extent of disease as Minimal, Moderate and Advanced (right panels; Supplementary Table 7).

