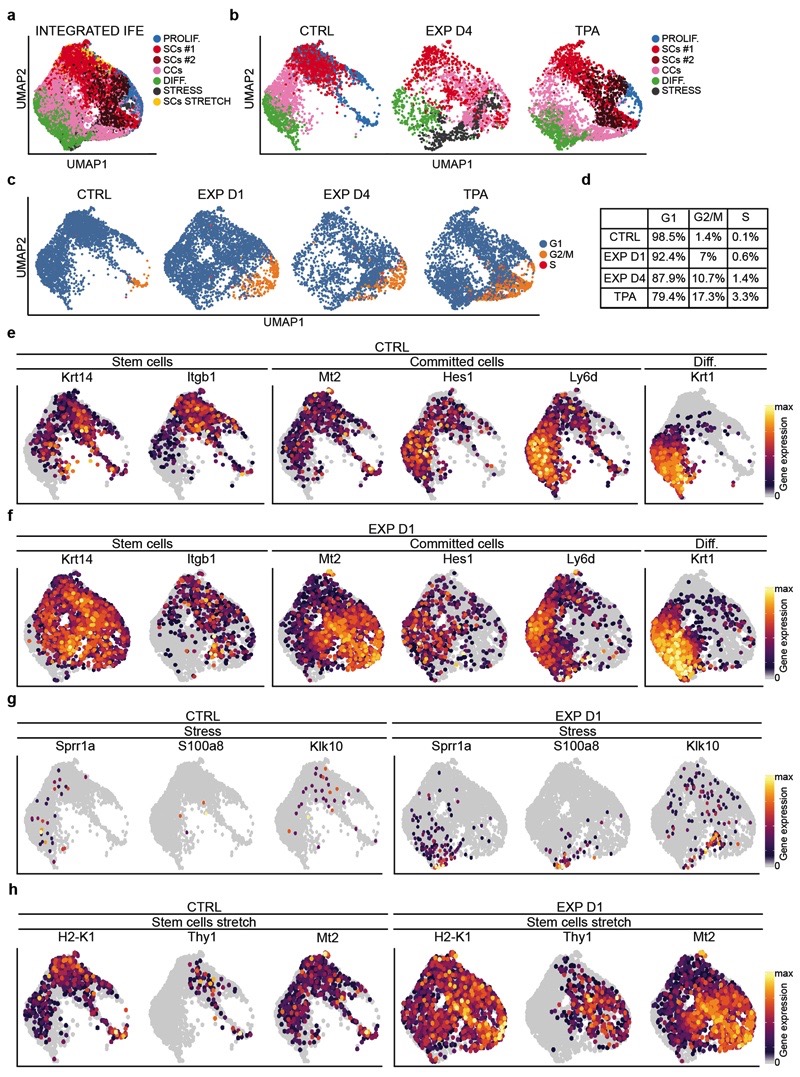
Extended Data Figure 7. Single-cell RNA sequencing clustering analysis on the IFE cells.
a, Integrated UMAP graphic representation of the IFE cells in CTRL, EXP D1, EXP D4 and TPA
single-cell RNA-seq data, showing the graph-based clustering results annotated by cell type. The proliferating stem cells (PROLIF.) are in light blue, the stem cells clusters are in red and dark red (SCs#2), the committed cells (CCs) cluster is in pink and the differentiated cells (DIFF.) are in green. The stress cells (STRESS) are in dark grey and the cluster of stem cells stretch (SCs STRETCH) in yellow. n=12747 cells. b, UMAP of the different samples (CTRL, EXP D1, EXP D4, TPA). c, Predicted cell-cycle phases assigned using the cyclone function from scran tool and visualized in the UMAP. Cells in G1 are in light blue, cells in G2/M are in orange and cells in S phase are in red. b-d, n=3142 cells CTRL, n=3756 cells EXP D1, n=2145 cells EXP D4, n=3704 cells TPA. d, Percentage of cells in the different cycling phase calculated on the total number of cells. e-h, UMAP plot colored by normalized gene expression values for the indicated gene and in the indicated sample. Gene expression is visualized as a color gradient going from grey to yellow with grey as indicator of no expression and yellow as indicator of maximal expression. n=3142 cells CTRL, n=3756 cells EXP D1.

