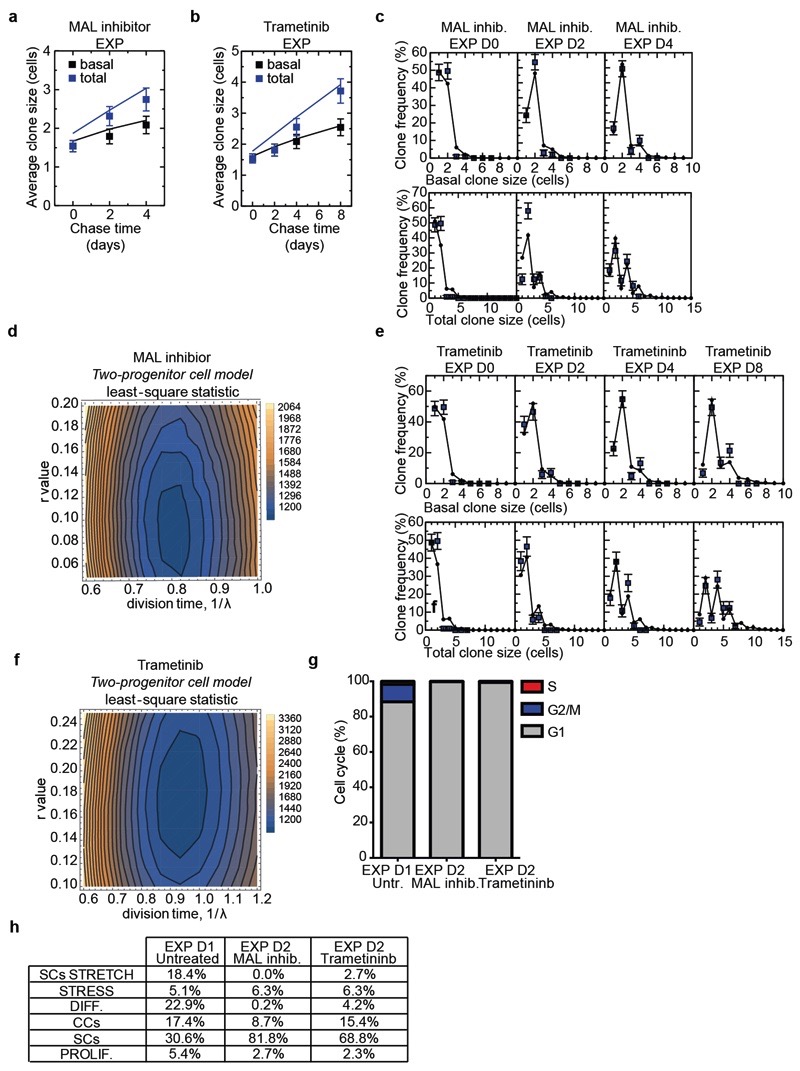
Extended Data Figure 12. Single-cell data analysis after MEK and MAL inhibition.
a, Average size of persisting clones in mice treated with MAL inhibitor during expansion, based on the basal (black) and total (blue) cell content. Points show data and lines denote the results from the fit to the two-compartment model (see main text and Methods). D0: n=115 clones from 7 mice; D2: n=86 clones from 3 mice; D4: n=83 clones from 3 mice. b, Average size of persisting clones in mice treated with Trametinib during expansion, based on the basal (black) and total (blue) cell content. Points show data and lines denote the results from the fit to the two-compartment model (see main text and Methods). D0: n=115 clones from 7 mice; D2: n=84 clones from 3 mice; D4: n=80 clones from 4 mice; D8: n=81 clones from 3 mice. c, Fit of the model to the clone size distribution during expansion upon MAL inhibition with 1/λ = 3.8 days and r = 0.08. D0: n=115 clones from 7 mice; D2: n=86 clones from 3 mice; D4: n=83 clones from 3 mice. d, Least-square values indicate the sensitivity of the fit parameters in (c). e, Fit of the model to the clone size distribution during expansion upon Trametininb treatment with 1/λ = 4.3 days and r = 0.17. D0: n=115 clones from 7 mice; D2: n=84 clones from 3 mice; D4: n=80 clones from 4 mice; D8: n=81 clones from 3 mice. f, Least-square values indicate the sensitivity of the fit parameters in (e). g, Predicted cell-cycle phases assigned using the cyclone function from scran tool of EXP D1 Untreated IFE, EXP D2 IFE treated with the MAL inhibitor and EXP D2 IFE treated with Trametinib. Cells in G1 are in grey, cells in G2/M are in blue and cells in S phase are in red. The percentage of cells in the different cycling phases is calculated on the total number of cells. h, Table showing the values of the percentage of the different cellular clusters in Figure 4j,k. a, b, Mean + s.d. c, e, Mean + s.e.m.

