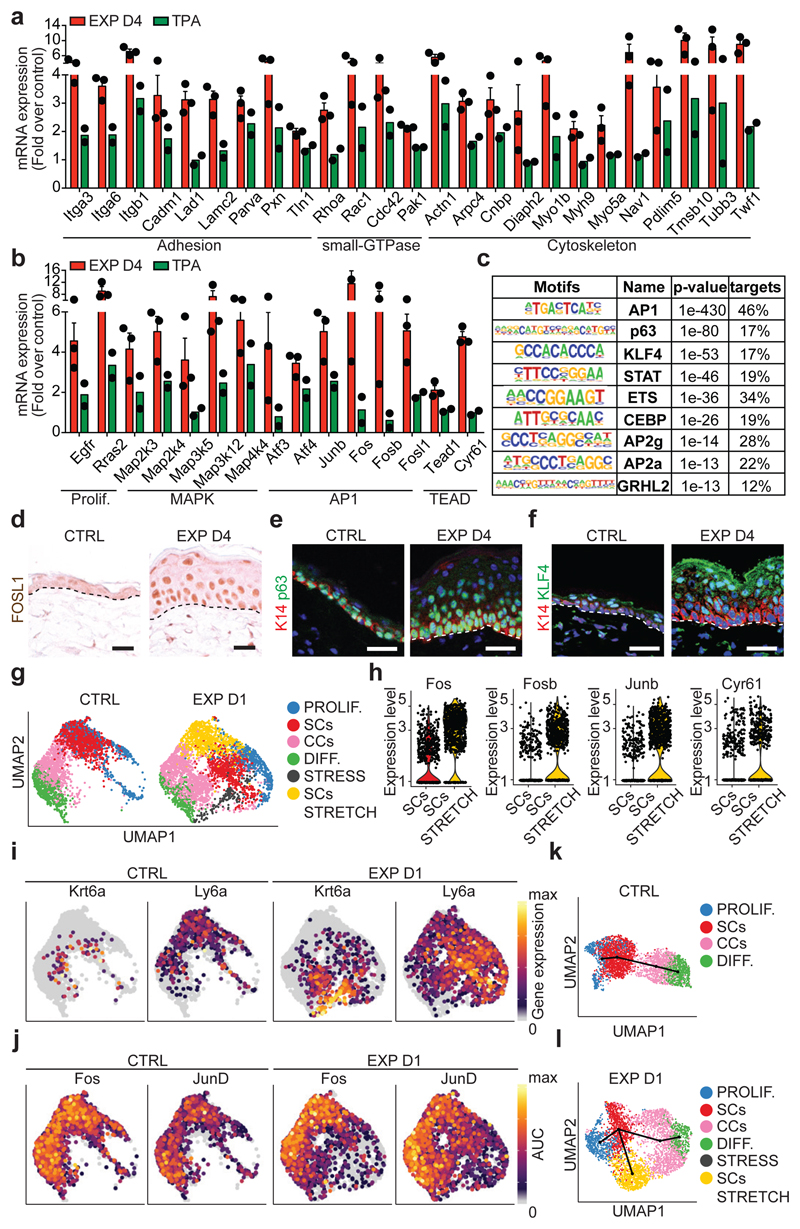
Figure 3. Transcriptional and chromatin remodelling associated with stretch-mediated skin expansion.
a, b, mRNA expression of genes upregulated in EXP D4 (n=3) compared to TPA (n=2). Bars are mean with s.e.m. of the fold change over the average value of the CTRL (n=3). c, TF motifs enriched in the ATAC-seq peaks that were upregulated in EXP D2 compared to CTRL (n=3262 target sequences, 46200 background sequences) as determined by Homer analysis using known motif search. d, Immunohistochemistry for FOSL1. e, f, Immunofluorescence for p63 (e) or KLF4 (f) in green, K14 (red) and nuclei with Hoechst (blue). d-f, Dashed lines delineate the basal lamina. Scale bar, 20 μm. n=3 independent experiments. g, Uniform Manifold Approximation and Projection (UMAP) graphic of the clustering analysis for the CTRL (n=3142 cells) and EXP D1 (n=3756 cells) IFE single-cell RNA-seq projected on an integrated embedding of the dataset. h, Violin plot of the indicated genes in EXP D1 in the SCs (n=700 cells) and SCs STRETCH (n=801 cells) clusters, see Source Data. i, UMAP plot coloured by normalized gene expression values for the indicated genes in the CTRL and EXP D1 IFE. Gene expression is visualized as a colour gradient going from grey to yellow, with grey as indicator of no expression (i.e. expression below the 50th percentile across each respective sample) and yellow as indicator of maximal expression. j, UMAP plots coloured by the degree of regulon activation for TFs differentially activated (AUC rank-sum test FDR corrected p-value < 0.05) in the different conditions. Colour scaling represents the normalized AUC value of target genes in the regulon being expressed as computed by SCENIC. k, l, Lineage trajectories (black lines) computed using Slingshot. i-l, CTRL (n=3142 cells) and EXP D1 (n=3756 cells).

