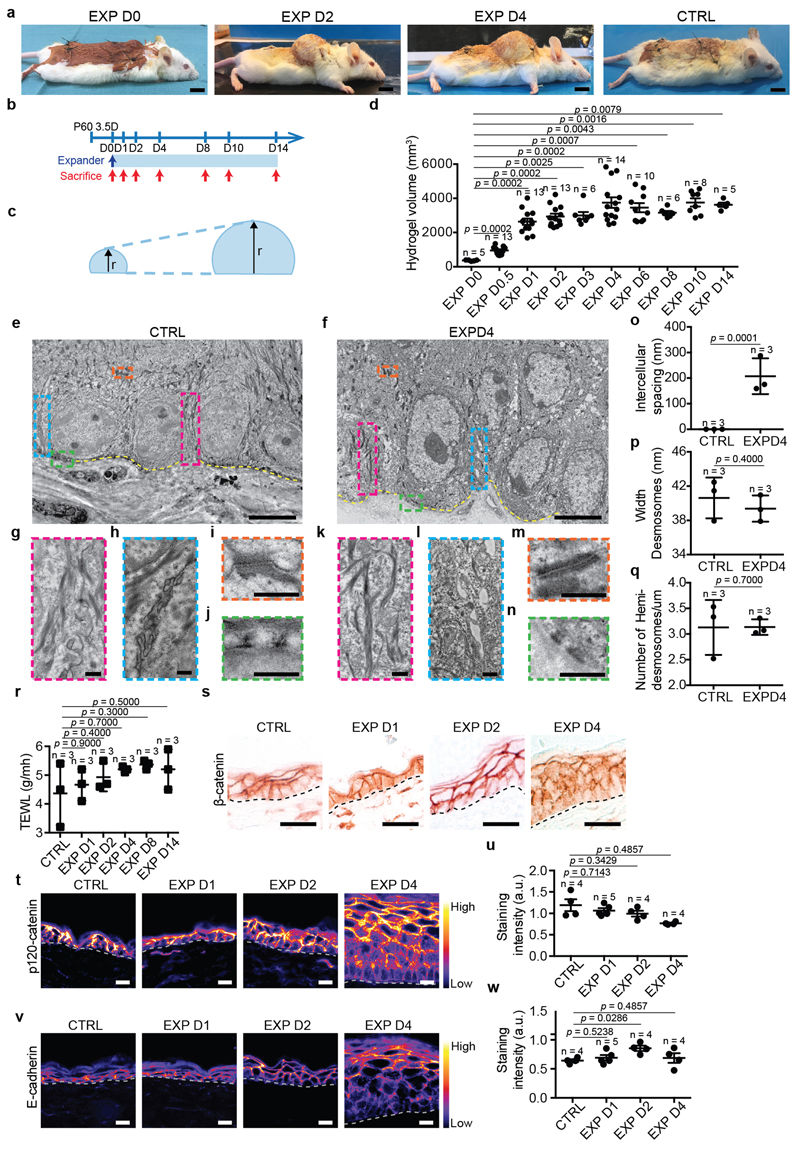
Extended Data Figure 1. A mouse model of mechanical stretch-mediated skin expansion.
a, Representative photographs of mice with the skin expander immediately after surgery at day (D) D0, D2, D4 and in control (CTRL) condition. Scale bar, 10 mm. The device was implanted on the back skin of the animals, close to the neck where the rigidity of the proximate cervical spines allows the hydrogel to stretch the skin during the inflation of the expander. Control mice were operated upon similarly but without introducing the hydrogel. b, Timeline of the experiment. CD1 mice were operated to place the expander and followed over time. c, Scheme showing the growth of the hydrogel. The arrows indicate the radius of the hemisphere. d, Hydrogel volume (measured by the height of the hydrogel and calculated as the volume of a hemisphere, see Methods, n=5 D0, n=13 D0.5, n=13 D1, n=13 D2, n=7 D3, n=13 D4, n=10 D6, n=6 D8, n=8 D10, n=5 D14 mice). en, Transmission electron microscopy (TEM) of ultrathin sections of control (e, g, h, i, j) and expanded (f, k, l, m, n) epidermis. In e and f, dashed yellow lines denote dermal-epidermal boundary and boxed area in pink, cerulean, orange and green are shown at higher magnification respectively in g and k, h and l, i and m, j and n. Scale bar, 5 μm. g, k, Keratin bundles. h, l, Ultrastructural analysis of cell-cell adhesion. i, m, Desmosomes. j, n, Hemidesmodomes. o, Quantification of the intercellular spacing on images as in h and l. Wilcoxon signed-rank test, two-sided. p, Quantification of the width of the desmosomes as in i and m. q, Quantification of the width of the number of hemidesmosomes per μm in j and n. r, Trans-epithelial water loss (TEWL) measurements from n=3 CD1 mice in CTRL and at different time point during expansion. s, Immunohistochemistry for the adherens junctions (AJ) component β-catenin, n=3 independent experiments. t, v, Representative images of AJ component p120-catenin (t) and E-cadherin (v) colour-coded for the signal intensity with ImageJ. Protein expression is visualized as a colour gradient going from black to yellow, with black as indicator of no expression and yellow as indicator of maximal expression. Scale bar, 10 μm. u, w, Quantification of the average integrated density signal for p120-catenin (u) and E-cadherin (w). Each data point is the average of 3 sections per mouse (n=3 mice per condition). o-q, The quantifications are made on n=3 different animals per condition on 10 different samples per mouse and represented as mean + s.e.m. g-n, Scale bar, 500 nm. d, p, q, r, u, w, Two-tailed Mann–Whitney test, mean + s.e.m.

