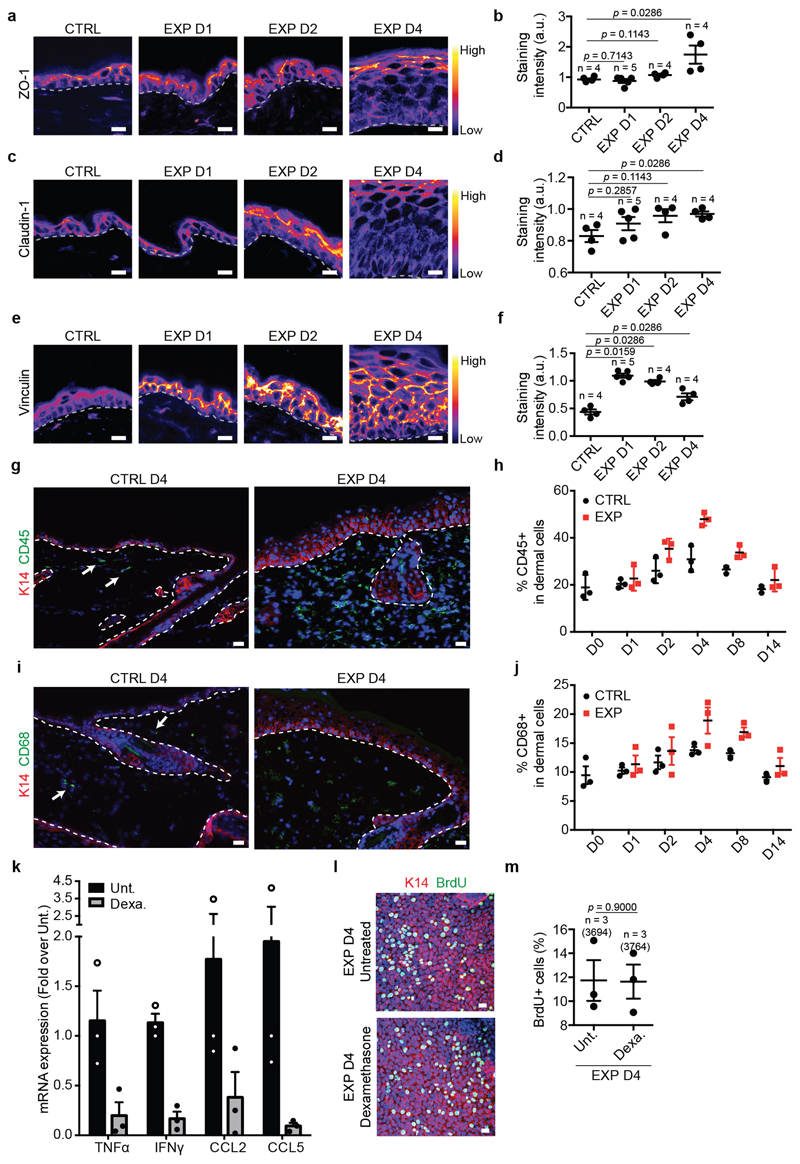
Extended Data Figure 2. Adhesion remodelling and inflammatory response during stretch-mediated skin expansion.
a, c, e, Representative images of the tight junction (TJ) components ZO-1 (a) and Claudin-1 (c) and of Vinculin (e) colour-coded for the signal intensity with ImageJ. Protein expression is visualized as a colour gradient going from black to yellow, with black as indicator of no expression and yellow as indicator of maximal expression. Scale bar, 10 μm b, d, f, Quantification of the average integrated density signal for ZO-1 (b), Claudin-1 (d) and Vinculin (f). The number of mice per condition is indicated. g, i, Immunostaining for K14 (red), inflammatory cells stained with CD45 (g) and macrophages stained with CD68 (i) (green) and Hoechst for nuclei (blue) on tissue sections. Scale bar, 10 μm. White arrows indicate positive cells, n=3 independent experiments. h, j, Percentage of CD45 (h) and CD68 (j) positive cells on the total dermal cells quantified based on the nuclear staining, n=3 mice per condition, mean per mouse + s.e.m. k, mRNA expression analysis for the indicated gene in Untreated (Unt., black) skin and skin treated with Dexamethasone (Dexa., grey). Fold change is expressed compared to one Unt. sample, n=3 mice per condition, mean per mouse + s.e.m. l, Maximum intensity projection of confocal pictures showing immunostaining for K14 (red), BrdU (green) and Hoechst for nuclei (blue) 4 hours following BrdU administration on whole mount epidermis. Scale bar, 10 μm. m, Proportion of basal cells that are BrdU positive (n=3,694 cells counted from 3 mice for Untreated and n=3,764 cells from 3 mice for the Dexamethasone treatment). a, c, e, g, i, Dashed lines indicate the basal lamina. b, d, f, m, Two-tailed Mann–Whitney test, mean per mouse + s.e.m.

