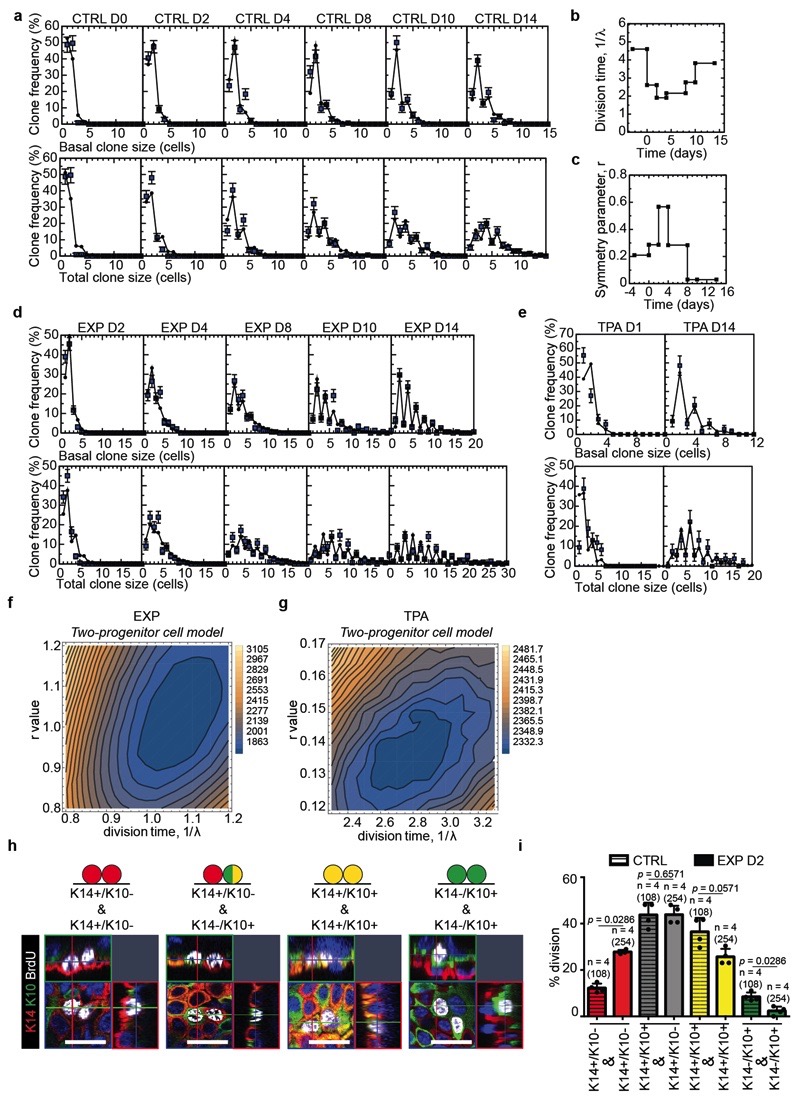
Extended Data Figure 4. Fit of the data to the two-progenitor model.
a, Fit of the model to the clone size distribution under homeostatic control conditions. Note that, with 1/λ = 4.6 days and r = 0.21, the model faithfully reproduces both the exponential-like clone size distribution and the predominance of clones bearing an even number of basal and total cell numbers. Mean + s.e.m. D0: n=115 clones from 7 mice; D2: n=175 clones from 7 mice; D4: n=136 clones from 5 mice; D8: n=159 clones from 3 mice; D10: n=146 clones from 3 mice; D14: n=195 clones from 4 mice. b, Change of division time (1λ) during stretch-mediated expansion as parameterised from the measured rate of BrdU incorporation, Fig. 1e. c, Change in the probability of symmetric division (parameter, r) during stretch-mediated skin expansion obtained from a fit of the two-compartment model to the clone size data (for details, see Supplementary Note). d, Corresponding fit of the two-compartment model to the clone size distribution during stretch-mediated expansion. The model accurately reproduces both the exponential-like clone size distribution and the predominance of clones bearing an even number of basal and total cell numbers. Notably, the sharp increase in even-sized clones at long times can only be recovered by limiting the frequency of renewing divisions well below that of the control value. Mean + s.e.m. D2: n=231 clones from 4 mice; D4: n=197 clones from 4 mice; D8: n=199 clones from 4 mice; D10: n=157 clones from 4 mice. e, Fit of the model to the clone size distribution at D14 under TPA treatment. Note that with 1/λ = 2.3 days and r = 0.15, the model faithfully reproduces both the exponential-like clone size distribution and the predominance of clones bearing an even number of basal and total cell numbers. Mean + s.e.m. D1: n=85 clones from 4 mice; D14: n=54 clones from 5 mice. f, g, Sensitivity analysis of the model fits depicted as a map of the total square-differences of the experimental basal/total clone size data and the respective model predictions as a function of the average division time, 1/λ, and the degree of imbalance towards stem cell loss/replacement, r, (see Methods). Panels (f) shows the results of the results of two-progenitor model and the EXP data, and (g) shows the results of two-progenitor model and the TPA data. For the EXP data (f), we have imposed the measured relative variation of the proliferation rate (as inferred from BrdU incorporation) (Fig. 1e and panel (b)) and an inferred relative variation of the r parameter as obtained from a model fit (c), while the two parameters in panel (f) represent variation in the net rates. h, Representative orthogonal confocal sections immunostained for K14 (red), K10 (green) following short-term BrdU (white) incorporation identifying cells biased for renewal (K14+/K10-), cells primed for differentiation (K14+/K10+) and differentiated cells (K14-/K10+). i, Percentage of the type of divisions in CTRL (108 divisions from n=4 mice) and EXP D2 (254 divisions from n=4 mice) based on short-term BrdU tracing and staining as in h. Two-tailed Mann–Whitney test, mean + s.e.m.

