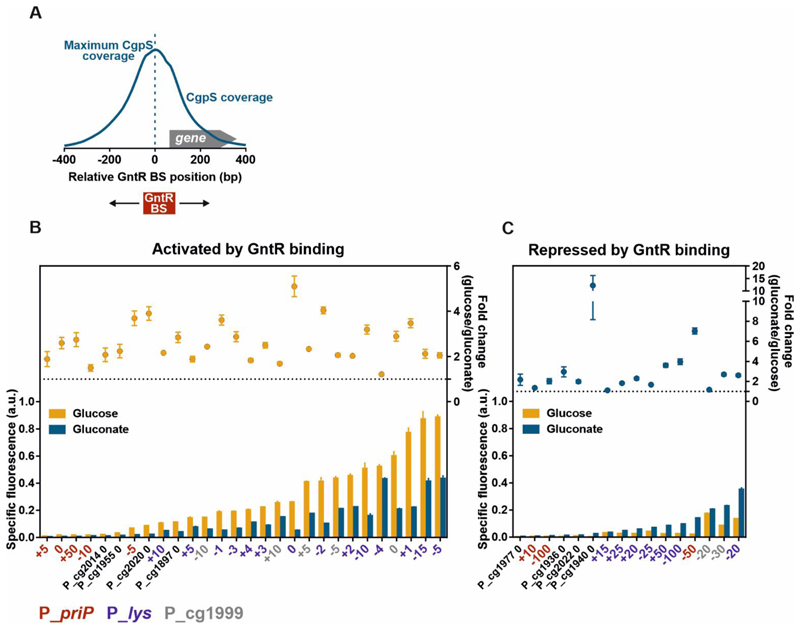
Figure 2. A synthetic GntR-dependent promoter library based on different CgpS target promoters with inserted GntR binding sites.
The library consists of previously obtained data for different recently described counter-silencer promoters18 as well as additionally constructed promoter variants based on the phage promoter PpriP following the same design approach. A) Schematic overview of a representative phage promoter which is bound by CgpS. The positions of the GntR binding site (BS) were referred to the nucleotide position associated with maximal CgpS binding27. The position directly upstream of this nucleotide was defined as position 0, negative numbers describe upstream and positive numbers downstream positions in relation to the CgpS peak maximum. B/C) Shown are reporter outputs driven by the promoters in the presence (gluconate) and absence (glucose) of the effector molecule after five hours of cultivation and the corresponding fold-change ratios. Promoters are grouped into two sets depending on their response to gluconate availability: activation by GntR binding (counter-silencing) (B) and repression by GntR binding (C) (p-values <0.05). Constructs based on the phage promoter PpriP (red), Plys (violet), or Pcg1999 (grey) are color-coded and indicate the position of the GntR binding site. Cells harbouring the plasmid-based synthetic promoter constructs were grown in CGXII medium supplemented with either 111/100 mM glucose or 100 mM gluconate. Bars represent the means and error bars the standard deviation of at least three biological replicates. Names indicate the platform promoter and the position of the GntR binding site positions. Specific fluorescence values were background corrected by subtracting values of strains harbouring the control plasmid pJC1-venus-term (no promoter in front of venus)74. Specific fluorescence was calculated by dividing the Venus fluorescence signal by the backscatter signal per time point63.

