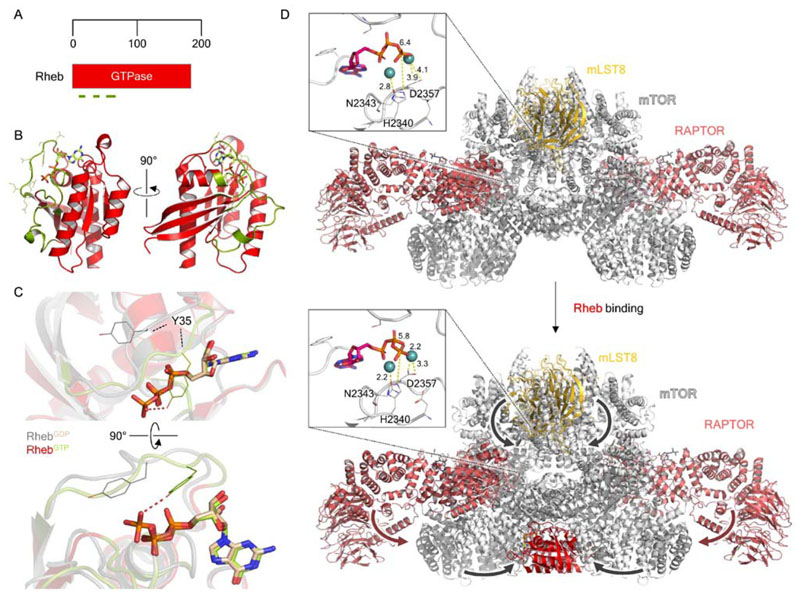
Figure 6. Structural biology of the small GTPase Rheb and the Rheb-dependent activation of mTORC1.
(A) Domain organization of Rheb. Olive green lines indicate, from N- to C terminus, the P-loop (residues 12-20), switch I (residues 33-41) and switch II (residues 6379) regions. (B) Crystal structure of GTP-bound Rheb (PDB ID: 1XTS), with bound GTP shown as light green in stick representation. The P loop, switch I and II regions are shown in olive green, as highlighted in A. (C) Focused view of the nucleotide binding pocket, highlighting the conformational difference between key GTP binding residue Y35 between the GDP- and GTP-bound states. (D) Comparison of the cryo-EM structures of mTORC1 alone (top; PDB ID: 6BCX; EMDB: EMD-7087) and mTORC1-Rheb (bottom; PDB ID: EMD-7086). Major conformational movements which occur upon Rheb binding, such as the N-HEAT rotation and kinase N- lobe compaction, are indicated by arrows. The mTOR kinase active sites are shown as insets in each, with the Mg2+ -coordinating residues N2343 and D2357, and catalytic residue H2340, shown. Interatomic distances labeled in Å indicate that in Rheb-bound mTORC1 these key residues shift by < 1 Å toward the bound ATP.

